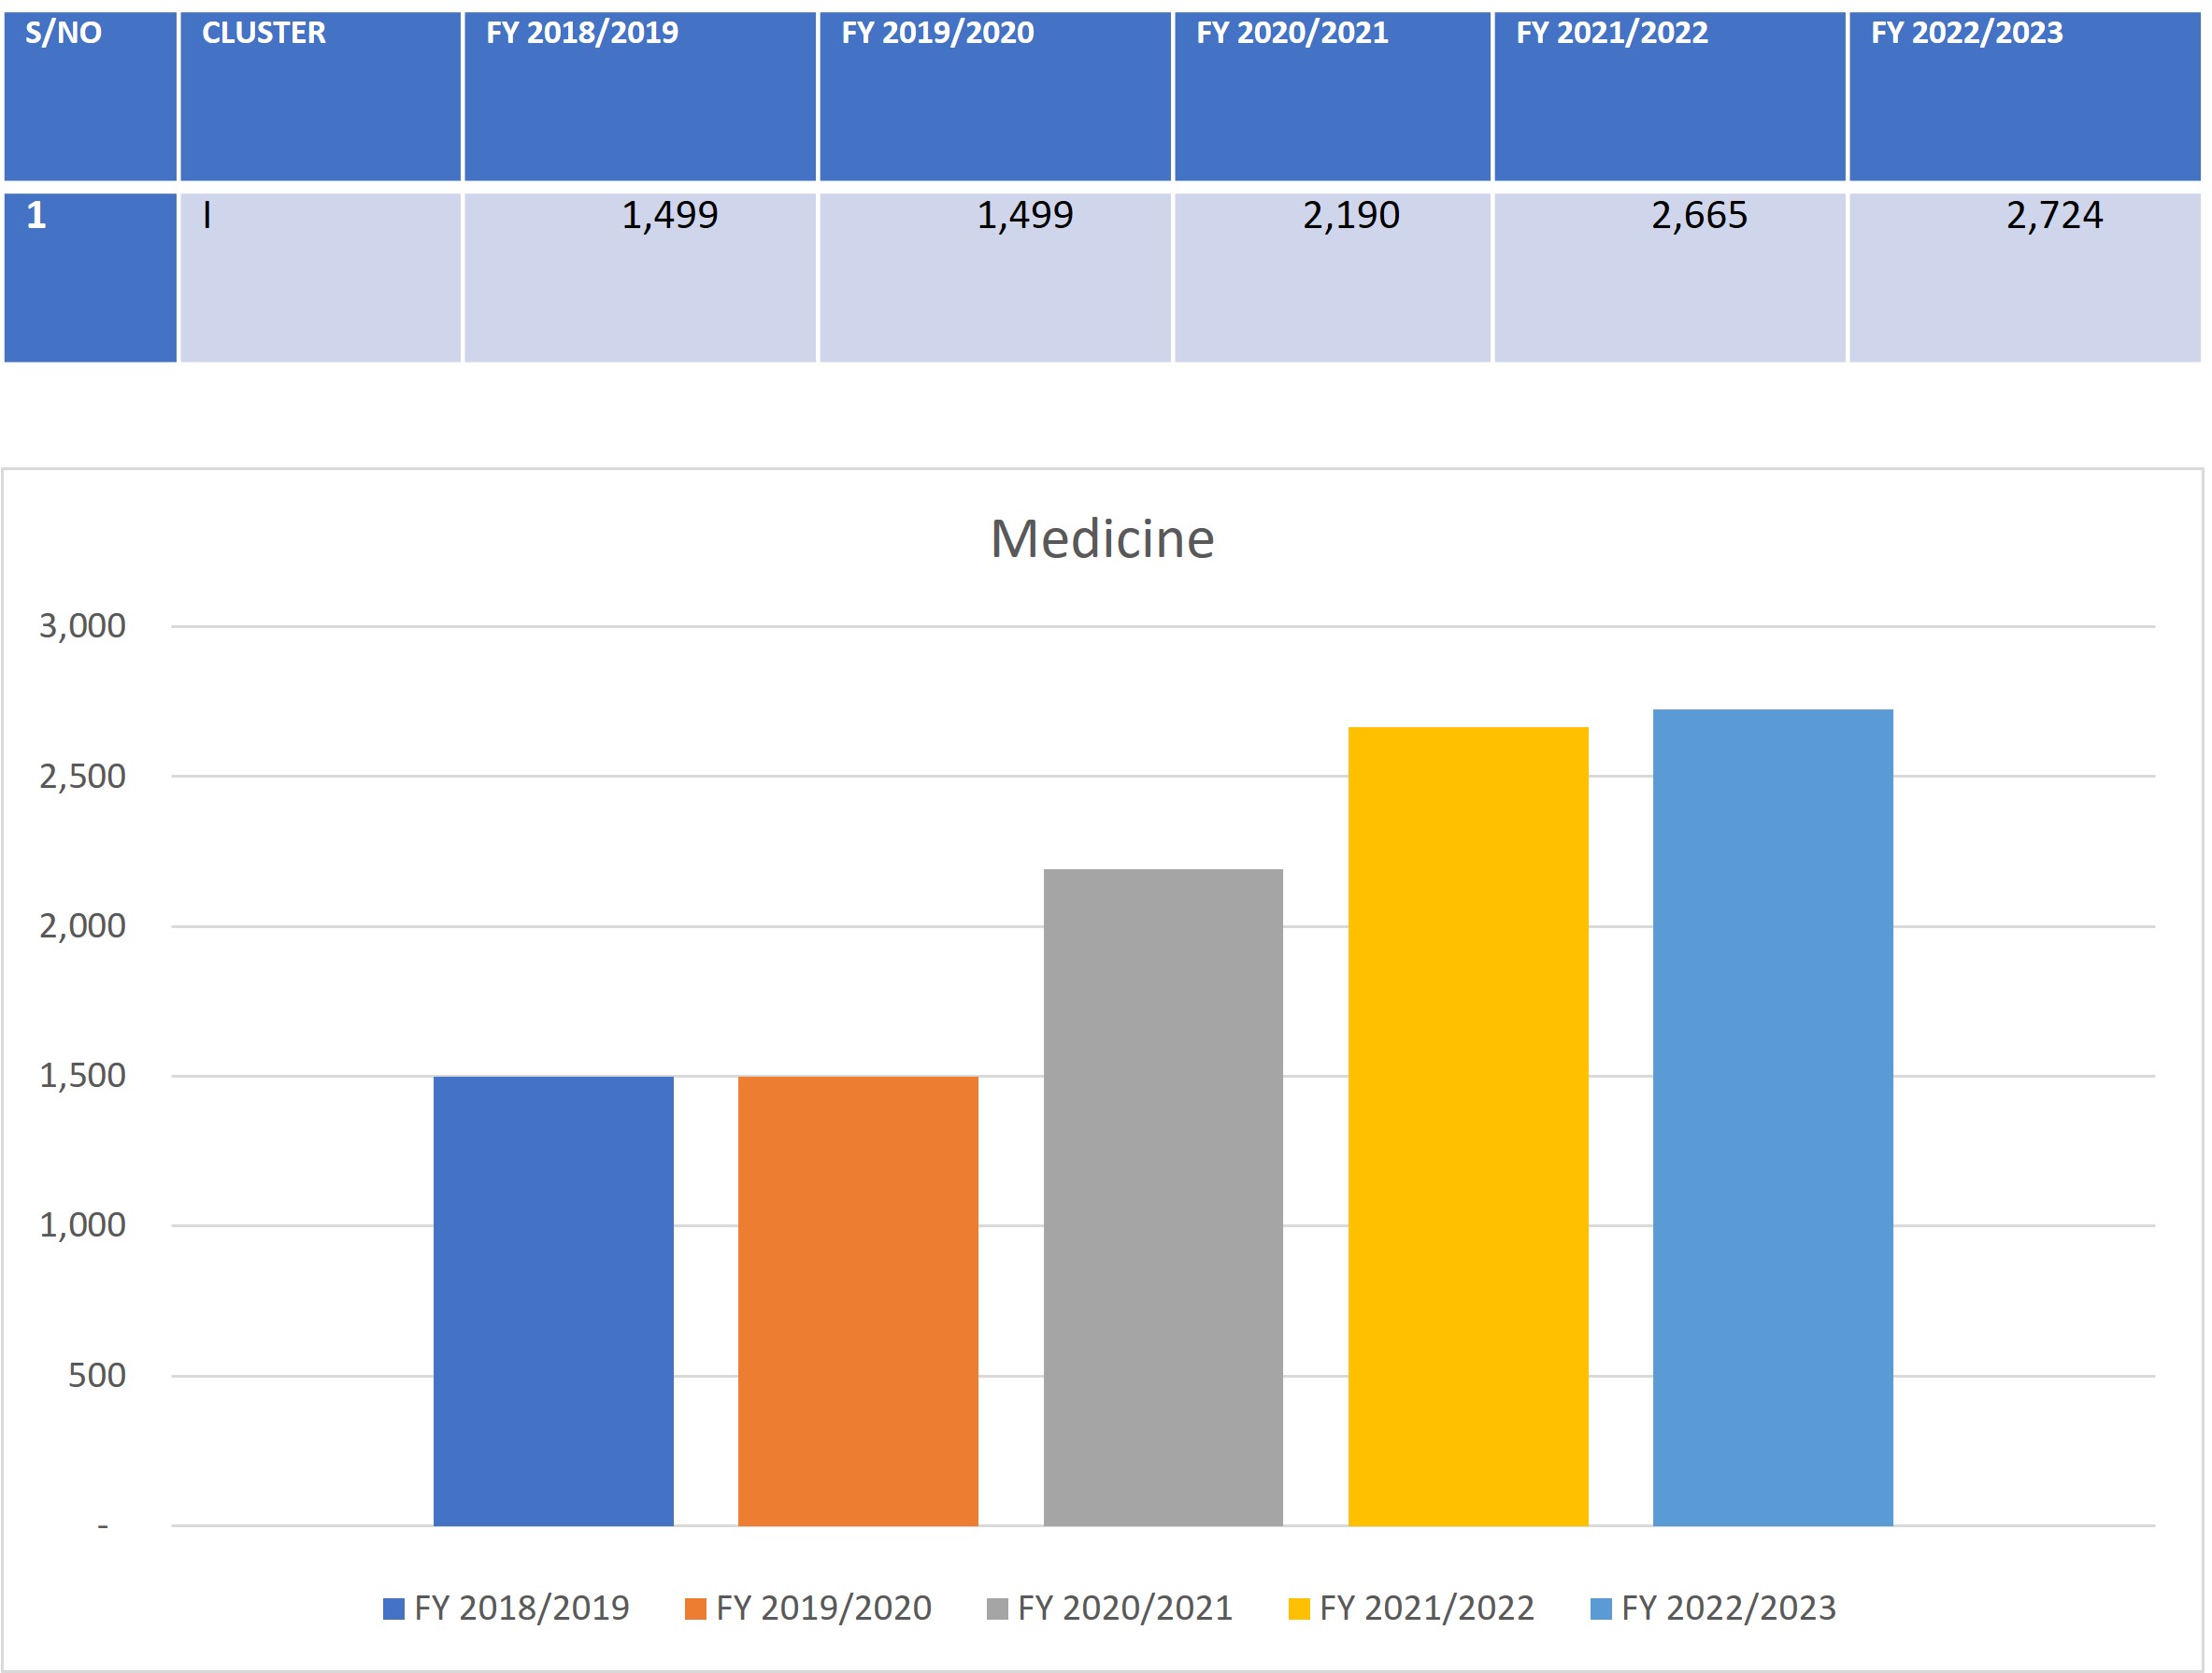
Graph 1 shows distribution of student numbers in Medicine since the Financial Year (FY) 2018/2019 to FY 2022/2023.
S/NO | CLUSTER | FY 2018/2019 | FY 2019/2020 | FY 2020/2021 | FY 2021/2022 | FY 2022/2023 |
1 | I | 1,499 | 1,499 | 2,190 | 2,665 | 2,724 |
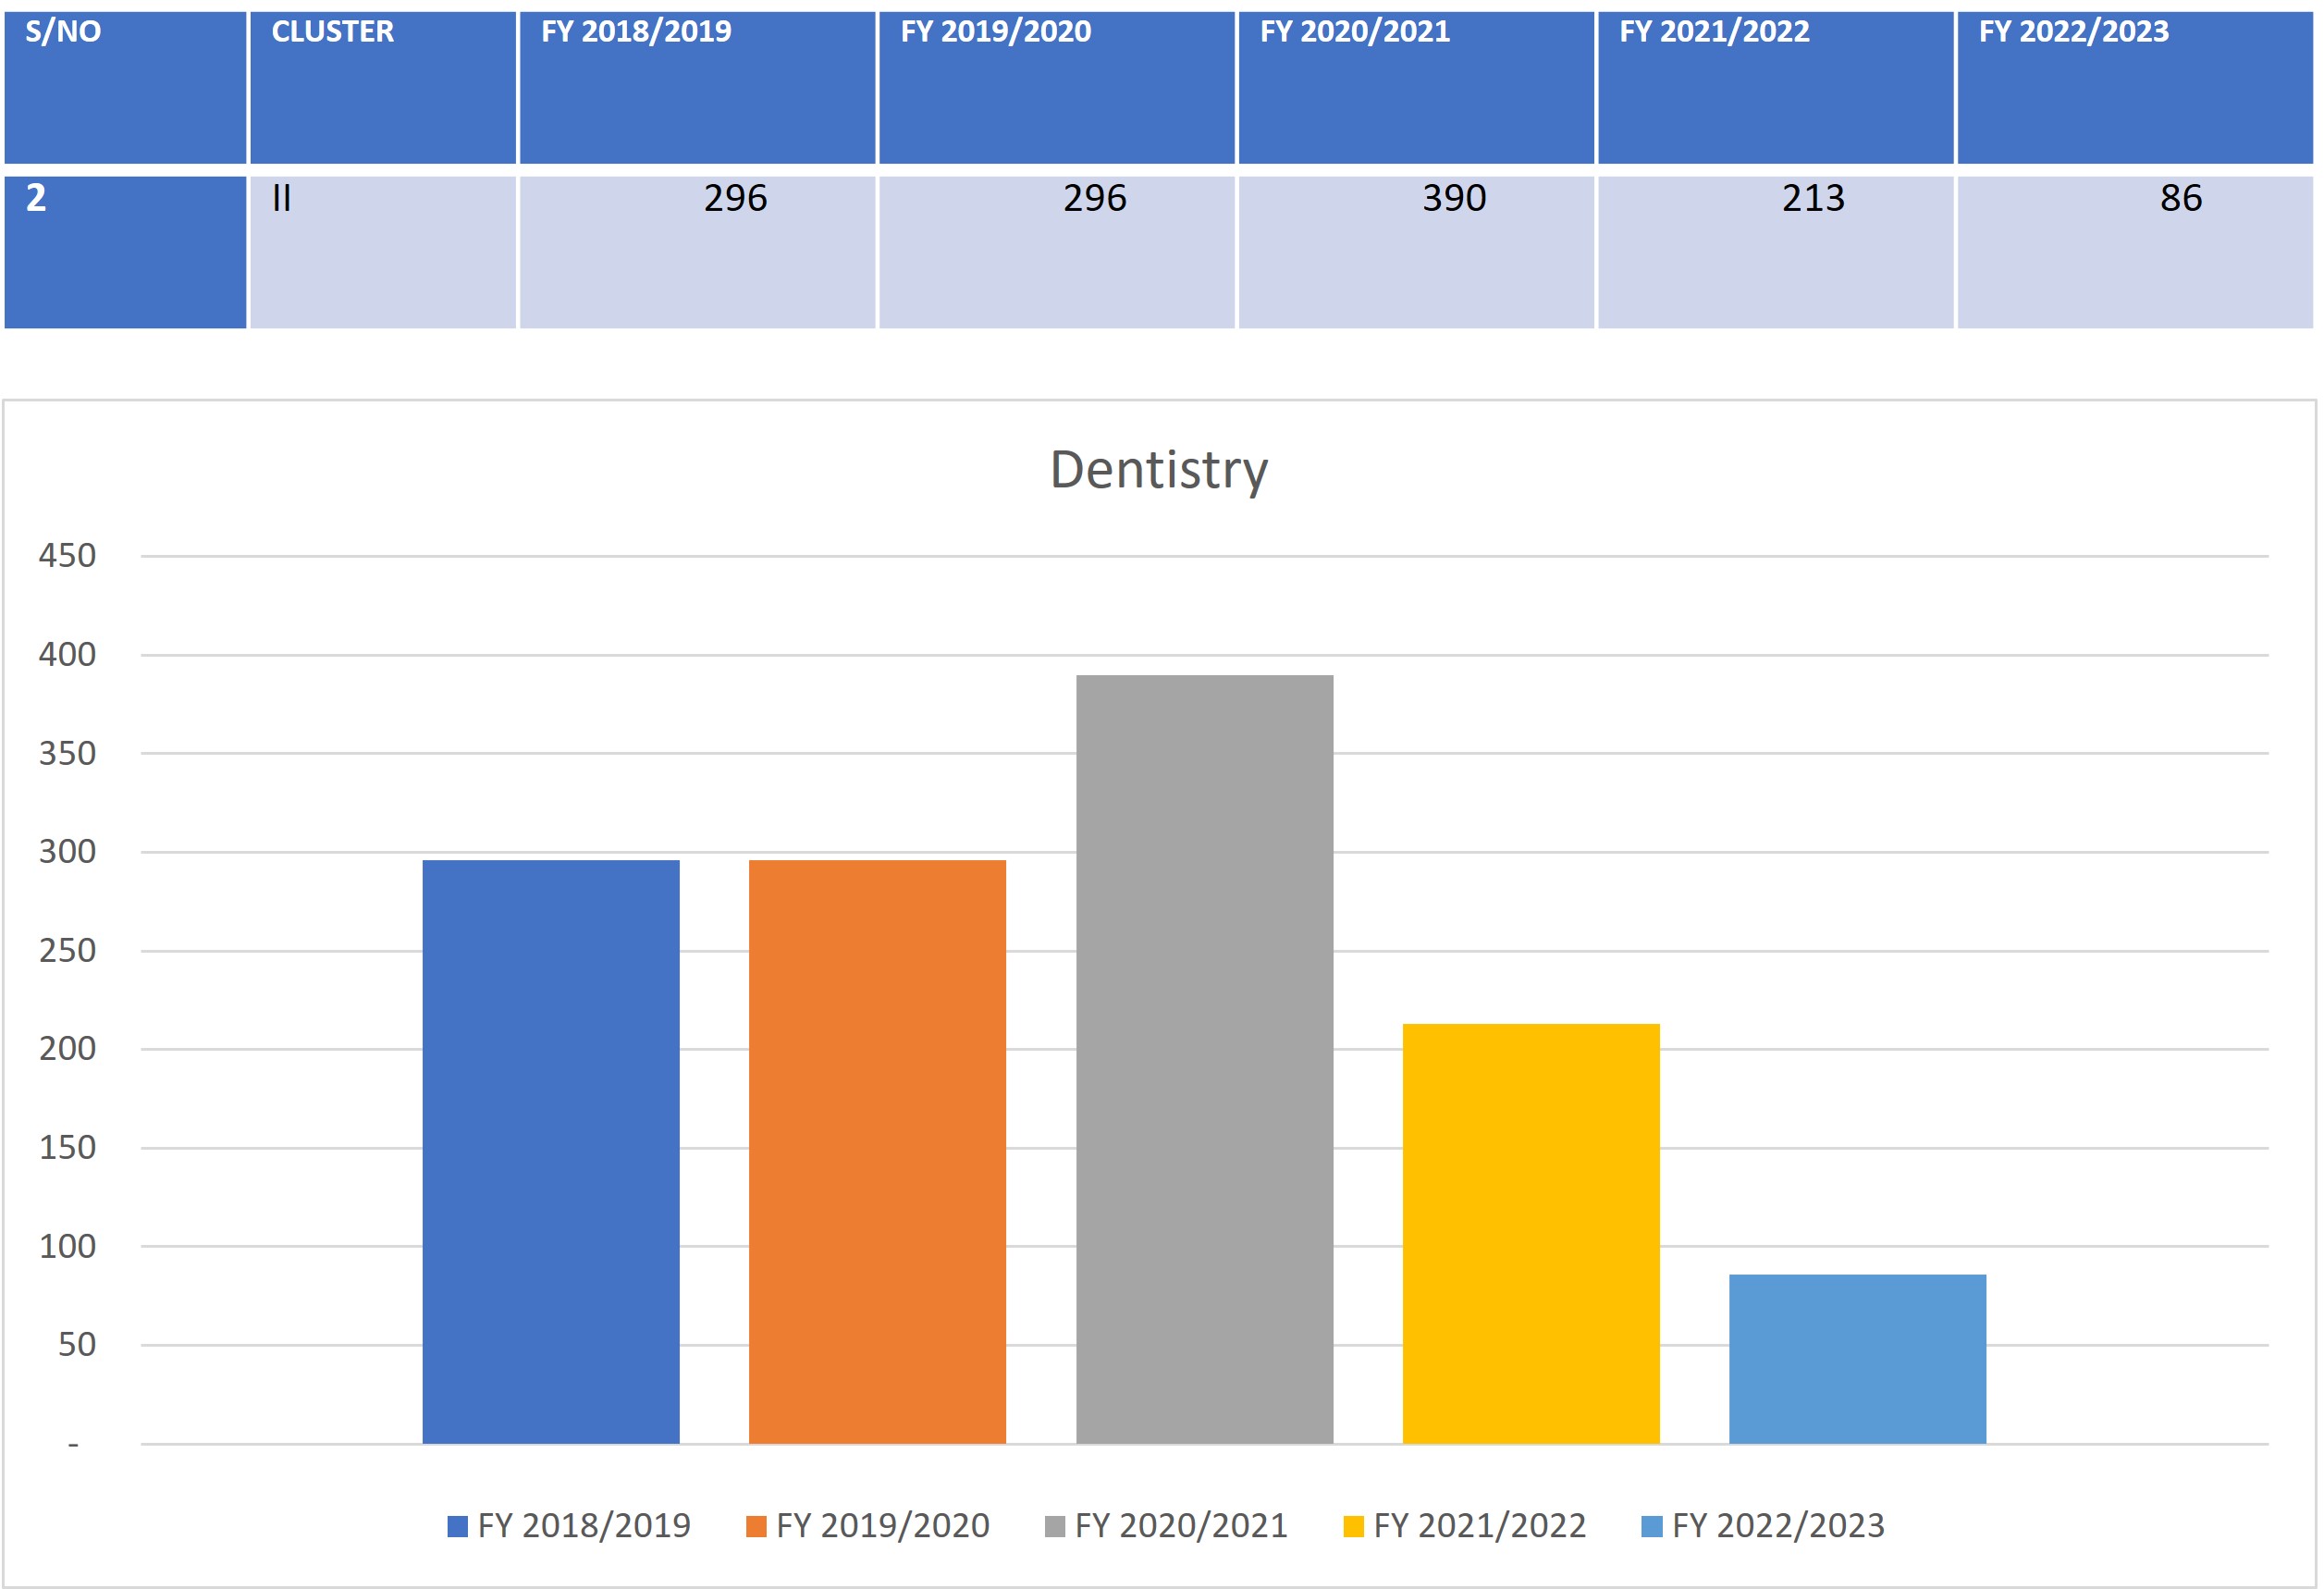
Graph 2 shows distribution of student numbers in Dentistry since the Financial Year (FY) 2018/2019 to FY 2022/2023.
S/NO | CLUSTER | FY 2018/2019 | FY 2019/2020 | FY 2020/2021 | FY 2021/2022 | FY 2022/2023 |
2 | II | 296 | 296 | 390 | 213 | 86 |
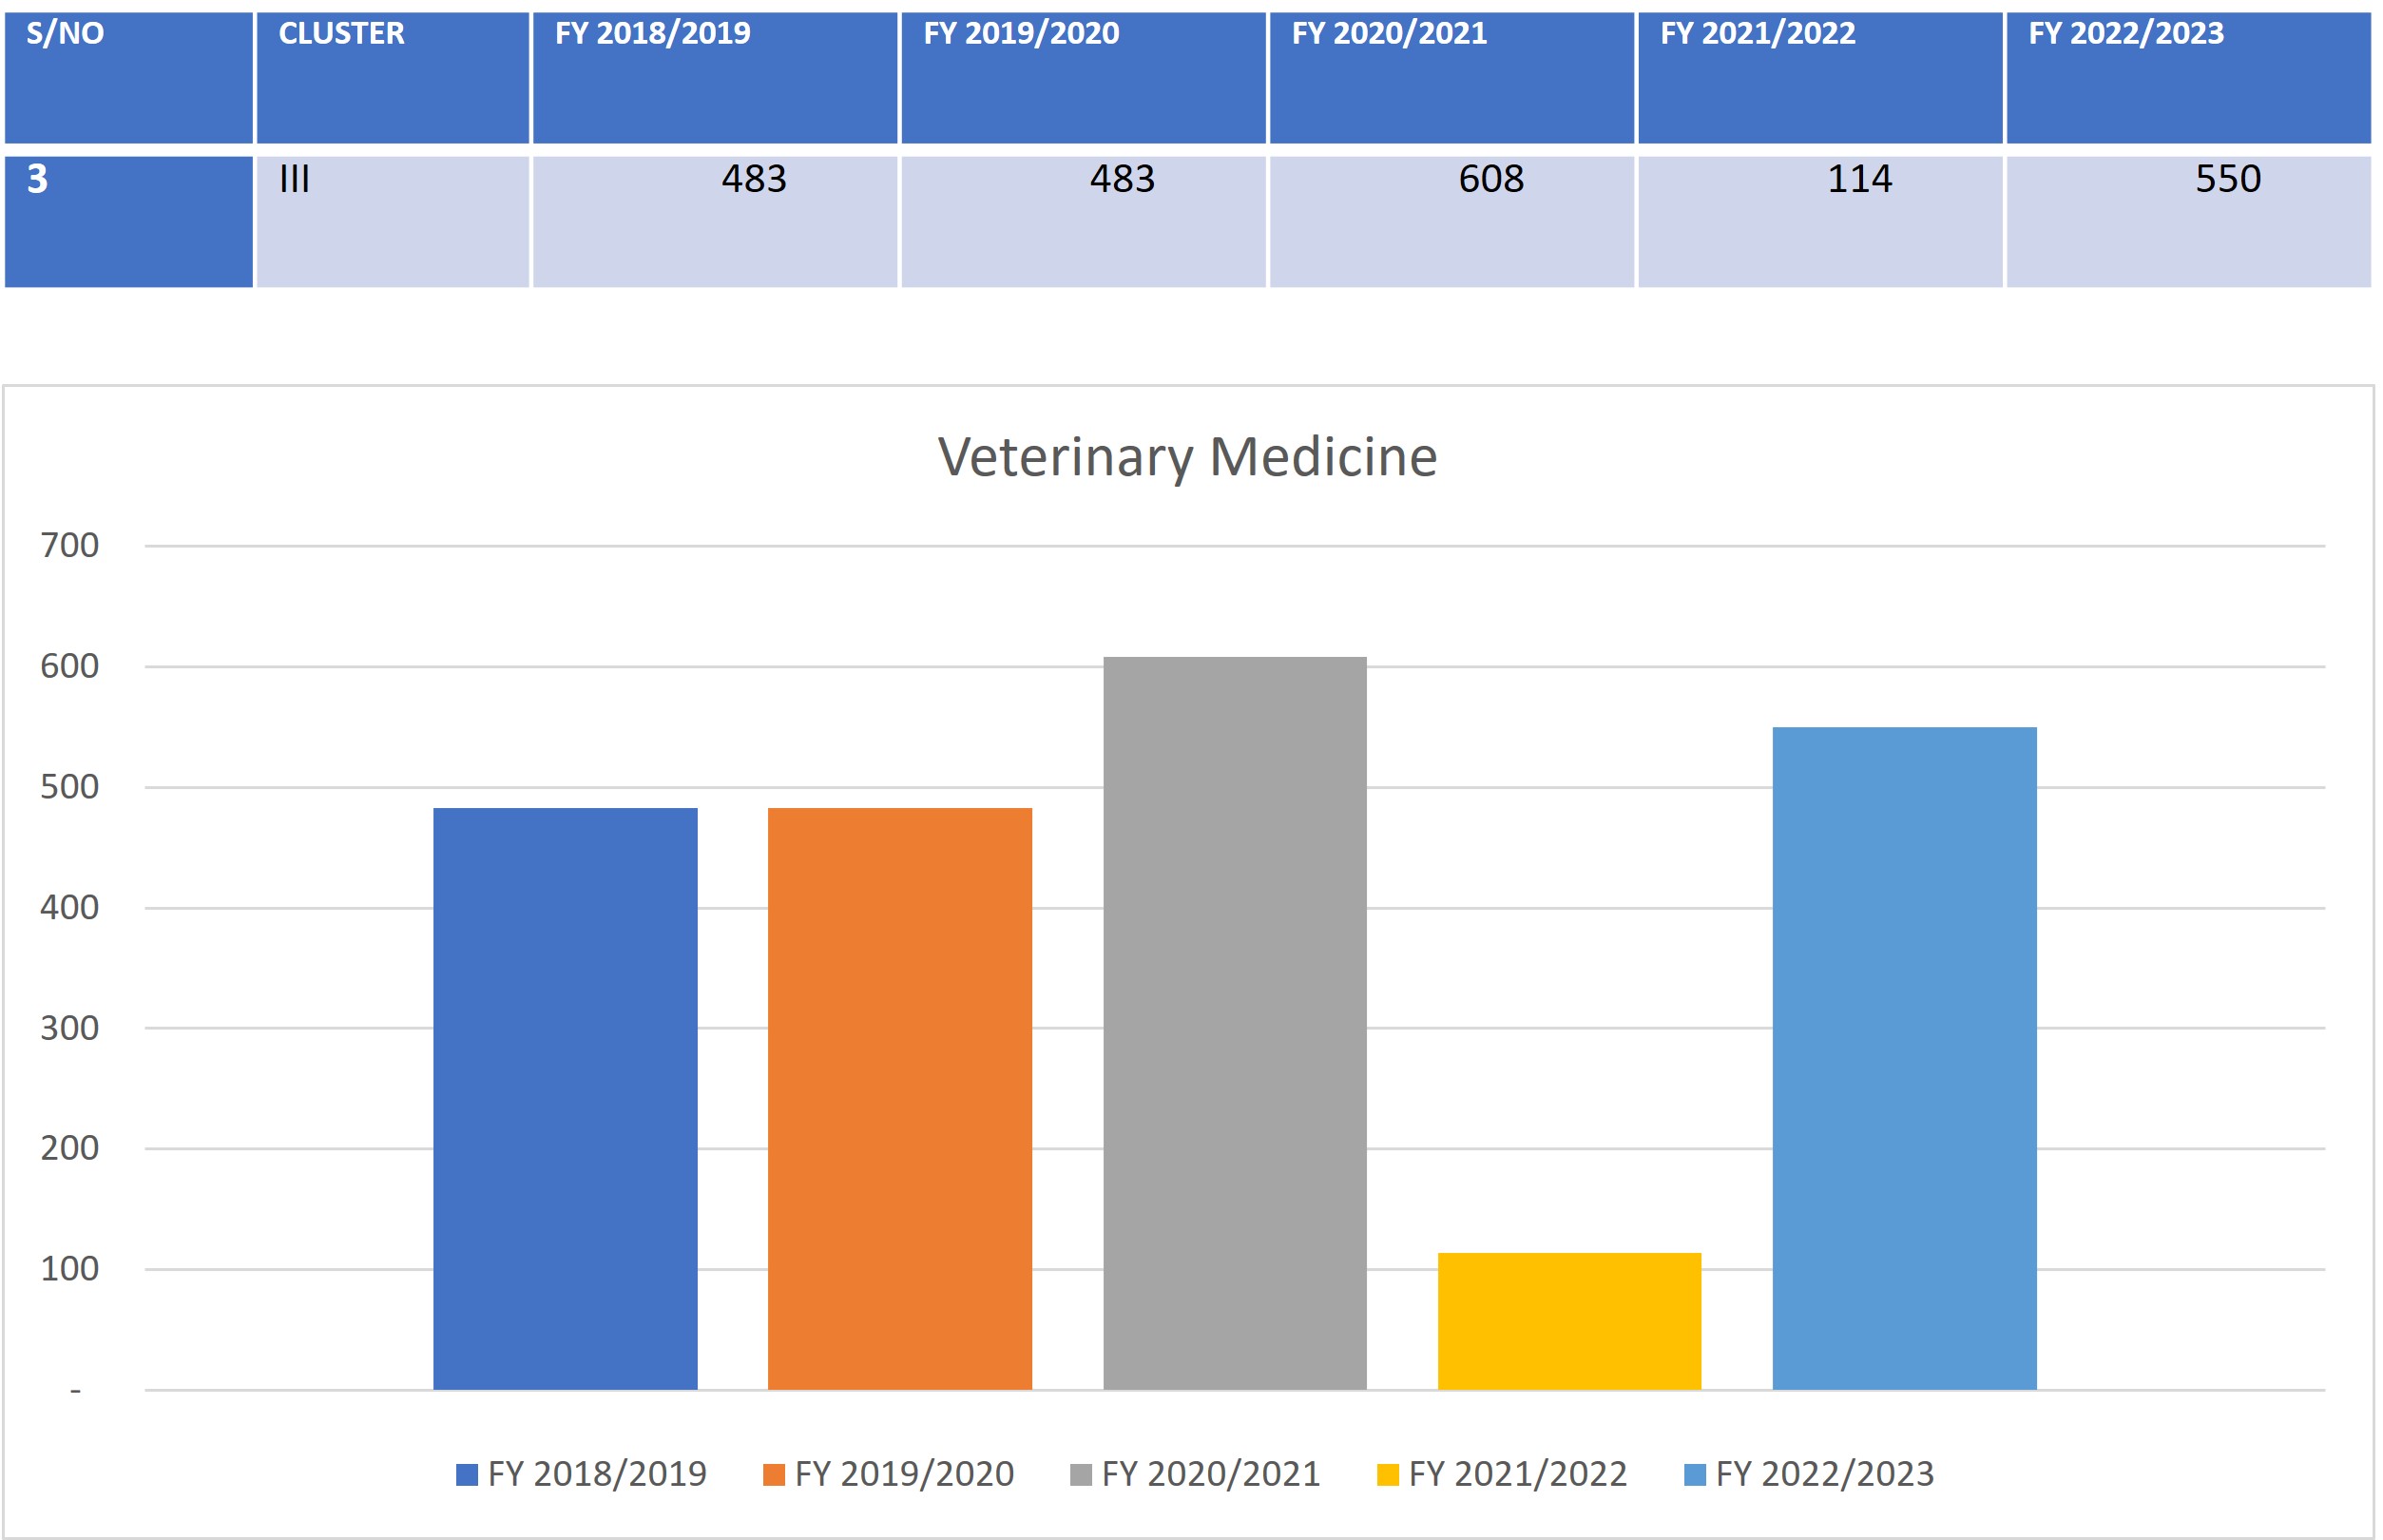
Graph 3 shows distribution of student numbers in Veterinary Medicine since the Financial Year (FY) 2018/2019 to FY 2022/2023.
S/NO | CLUSTER | FY 2018/2019 | FY 2019/2020 | FY 2020/2021 | FY 2021/2022 | FY 2022/2023 |
3 | III | 483 | 483 | 608 | 114 | 550 |
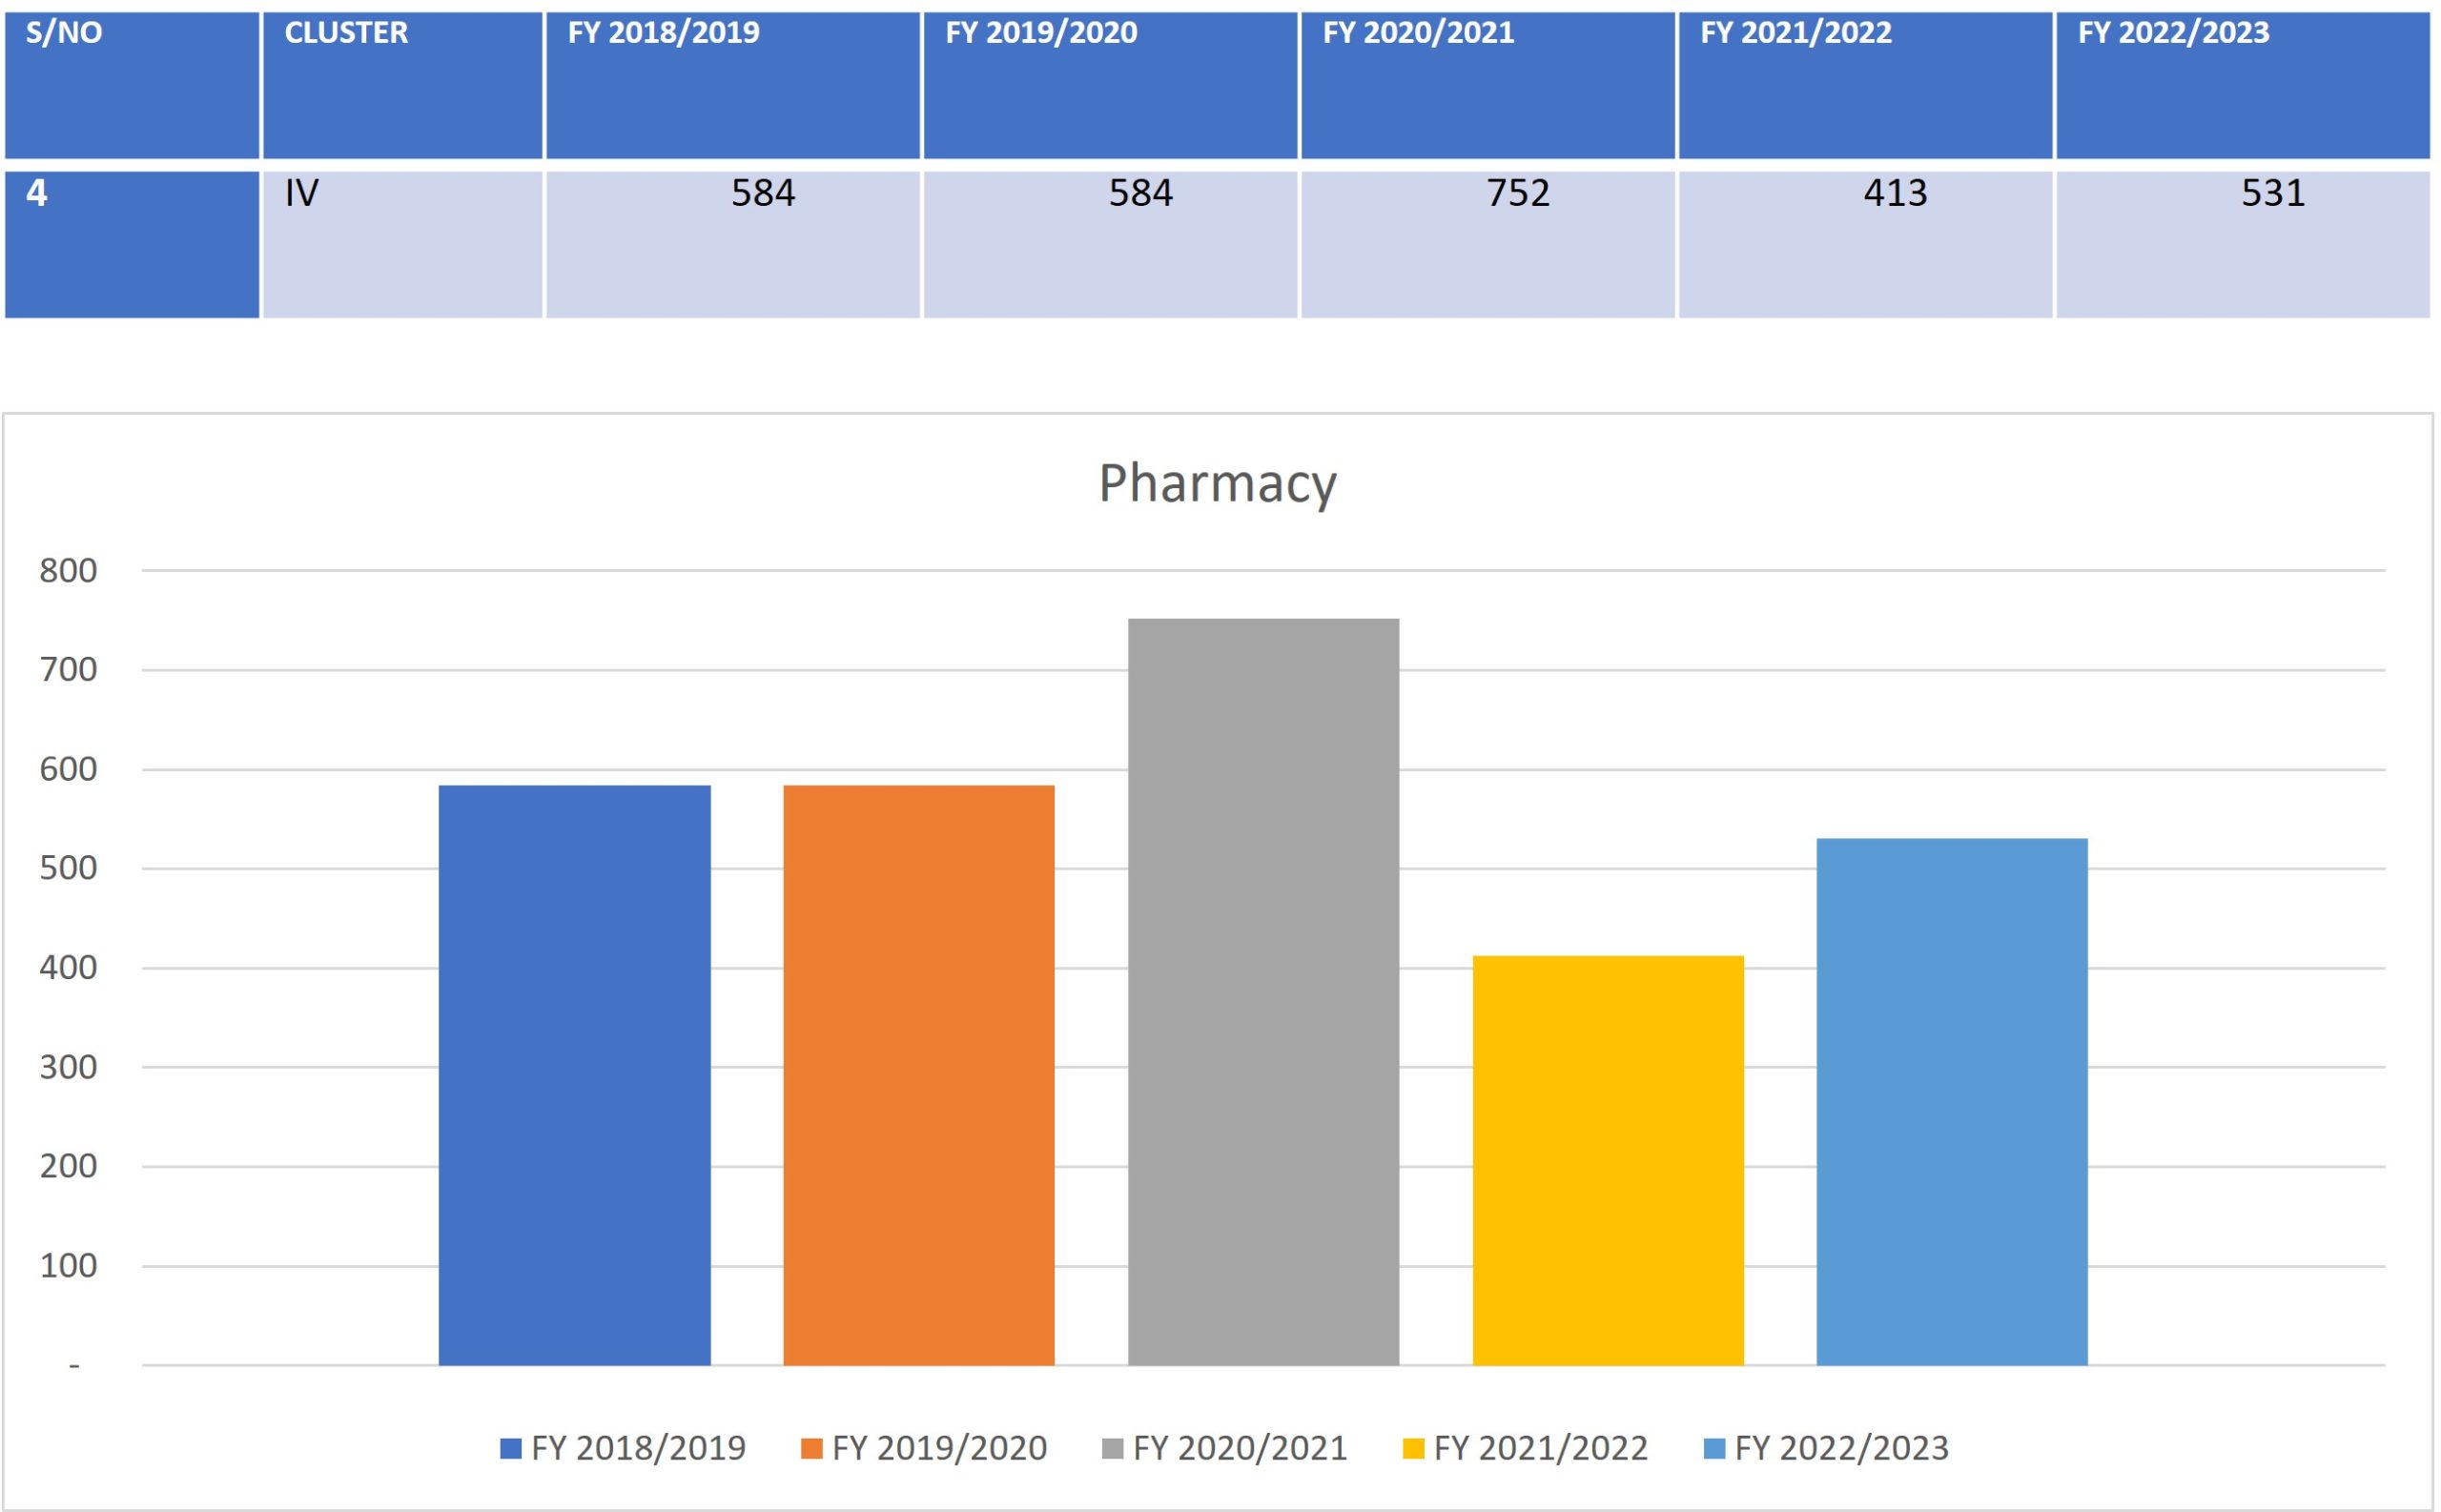
Graph 4 shows distribution of student numbers in Pharmacy since the Financial Year (FY) 2018/2019 to FY 2022/2023.
S/NO | CLUSTER | FY 2018/2019 | FY 2019/2020 | FY 2020/2021 | FY 2021/2022 | FY 2022/2023 |
4 | IV | 584 | 584 | 752 | 413 | 531 |
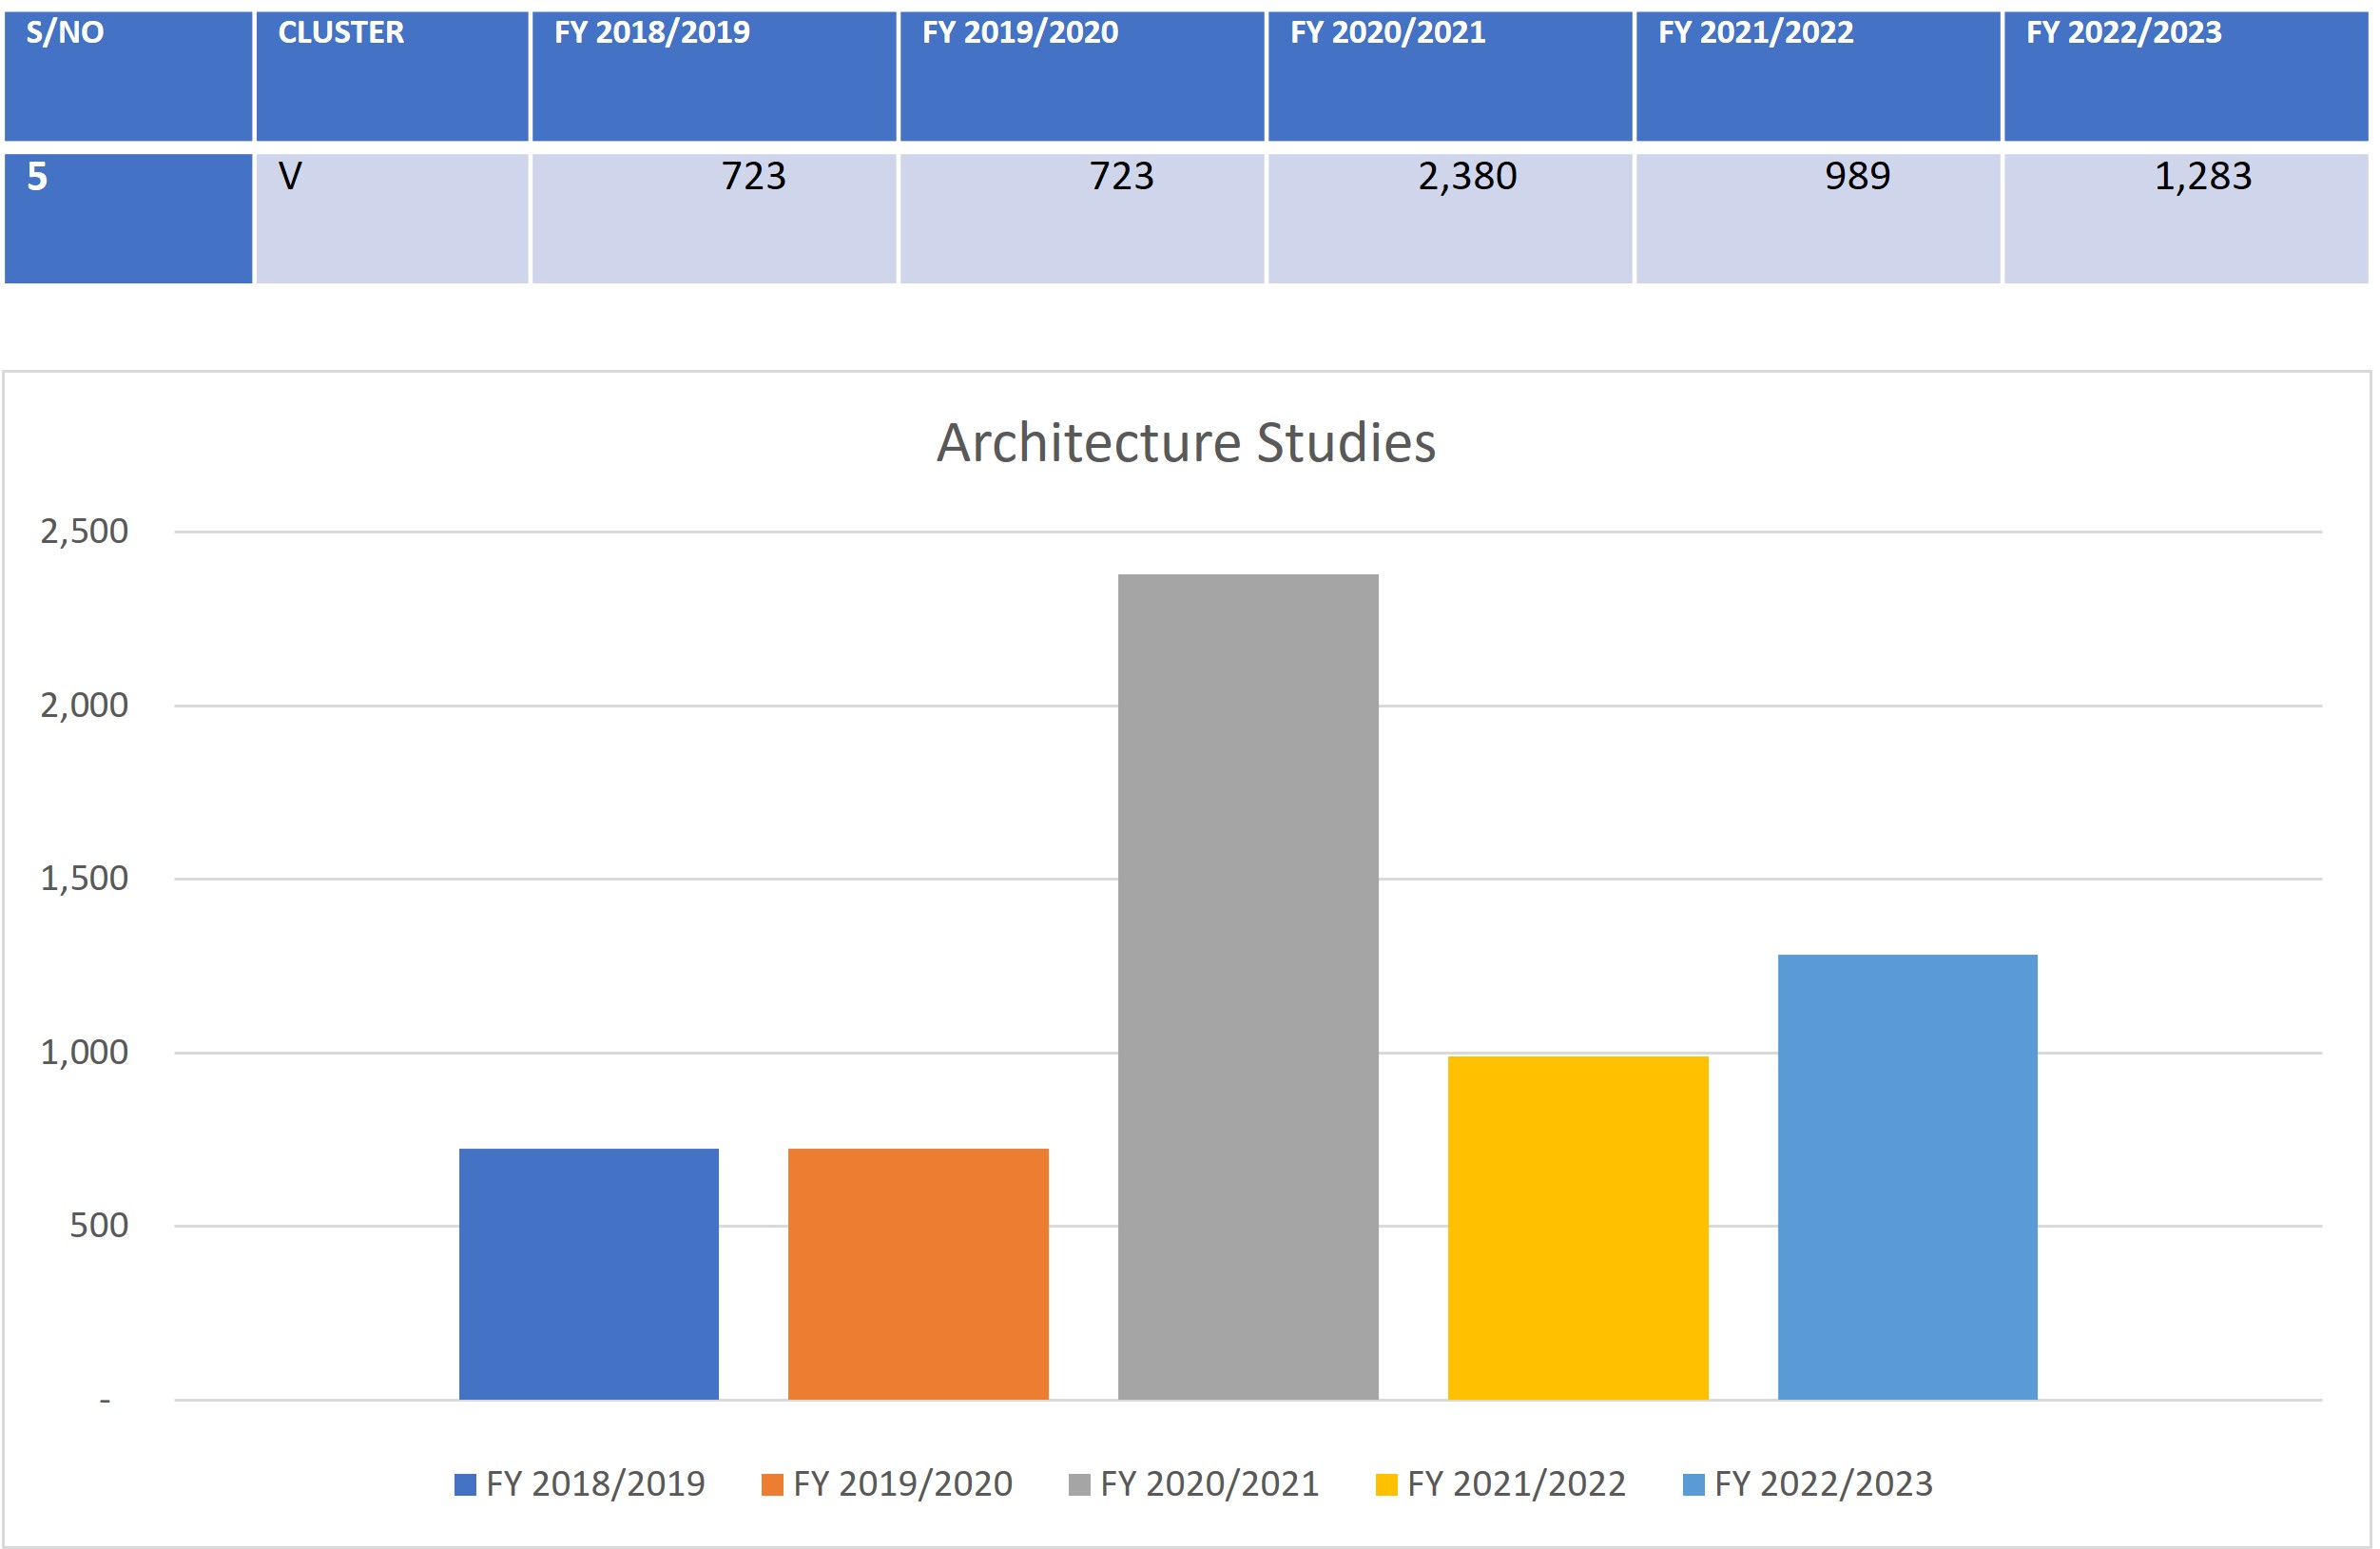
Graph 5 shows distribution of student numbers in Architectural Studies since the Financial Year (FY) 2018/2019 to FY 2022/2023.
S/NO | CLUSTER | FY 2018/2019 | FY 2019/2020 | FY 2020/2021 | FY 2021/2022 | FY 2022/2023 |
5 | V | 723 | 723 | 2,380 | 989 | 1,283 |
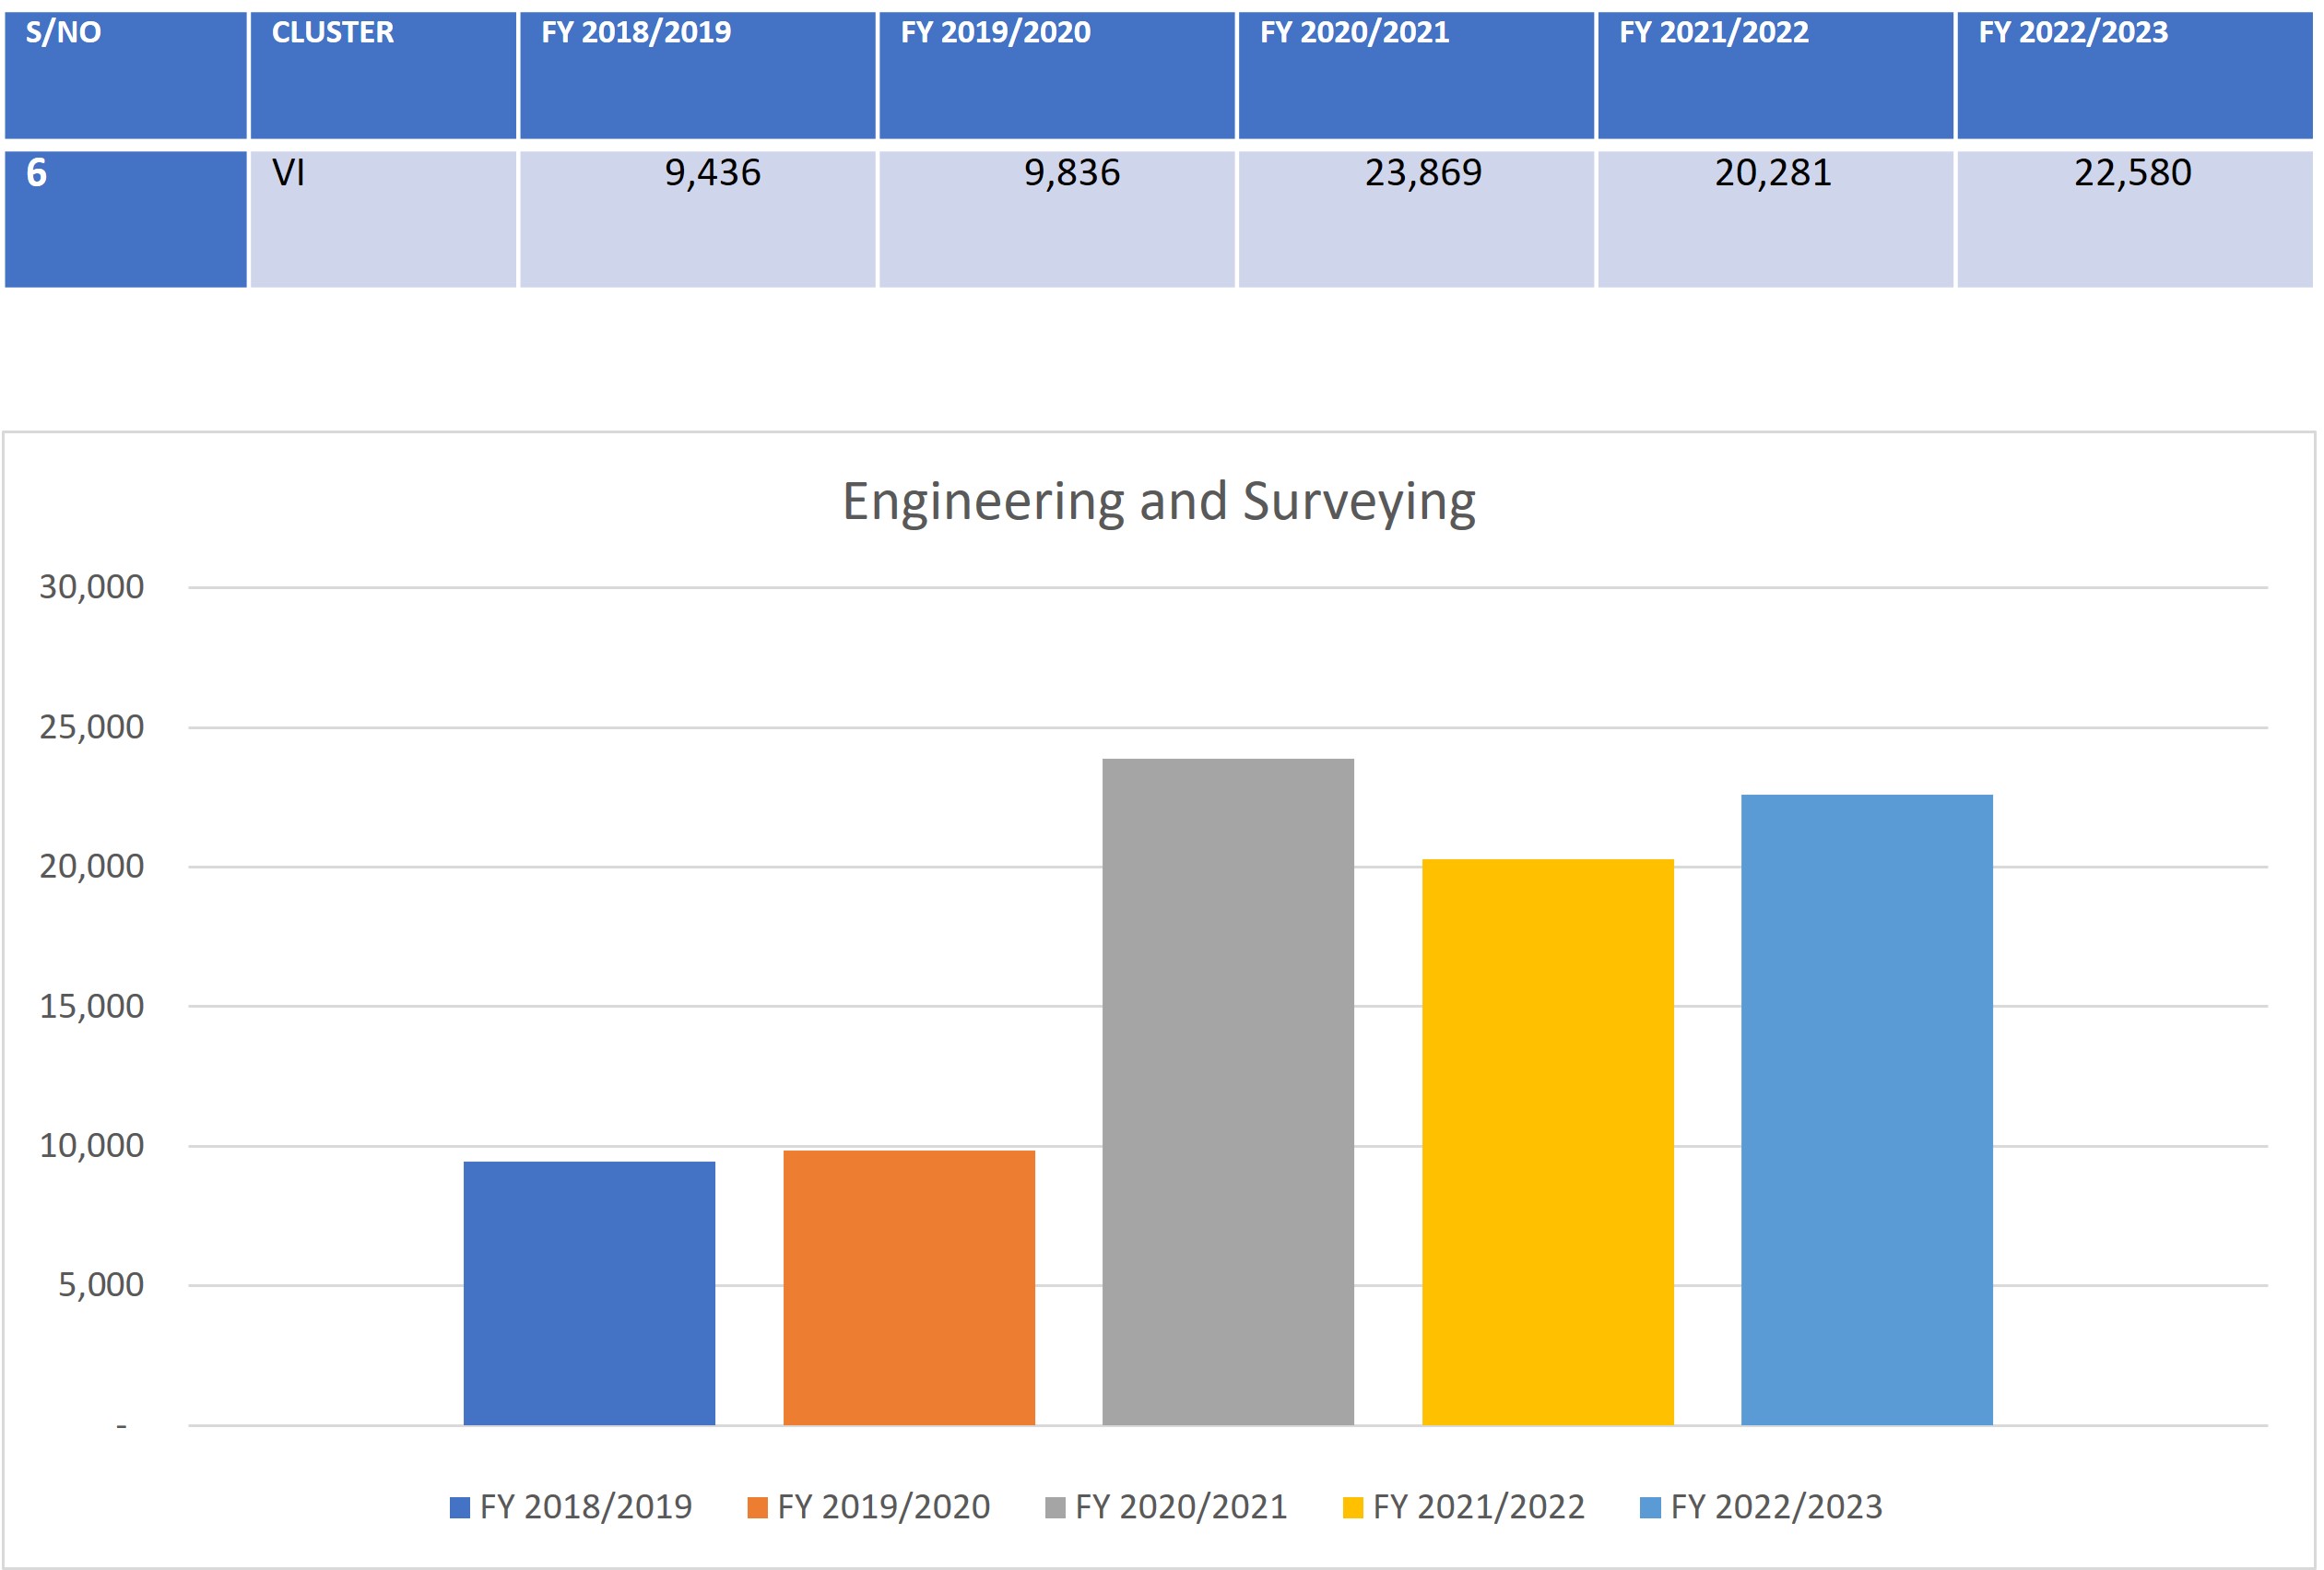
Graph 6 shows distribution of student numbers in Engineering and Surveying since the Financial Year (FY) 2018/2019 to FY 2022/2023.
S/NO | CLUSTER | FY 2018/2019 | FY 2019/2020 | FY 2020/2021 | FY 2021/2022 | FY 2022/2023 |
6 | VI | 9,436 | 9,836 | 23,869 | 20,281 | 22,580 |
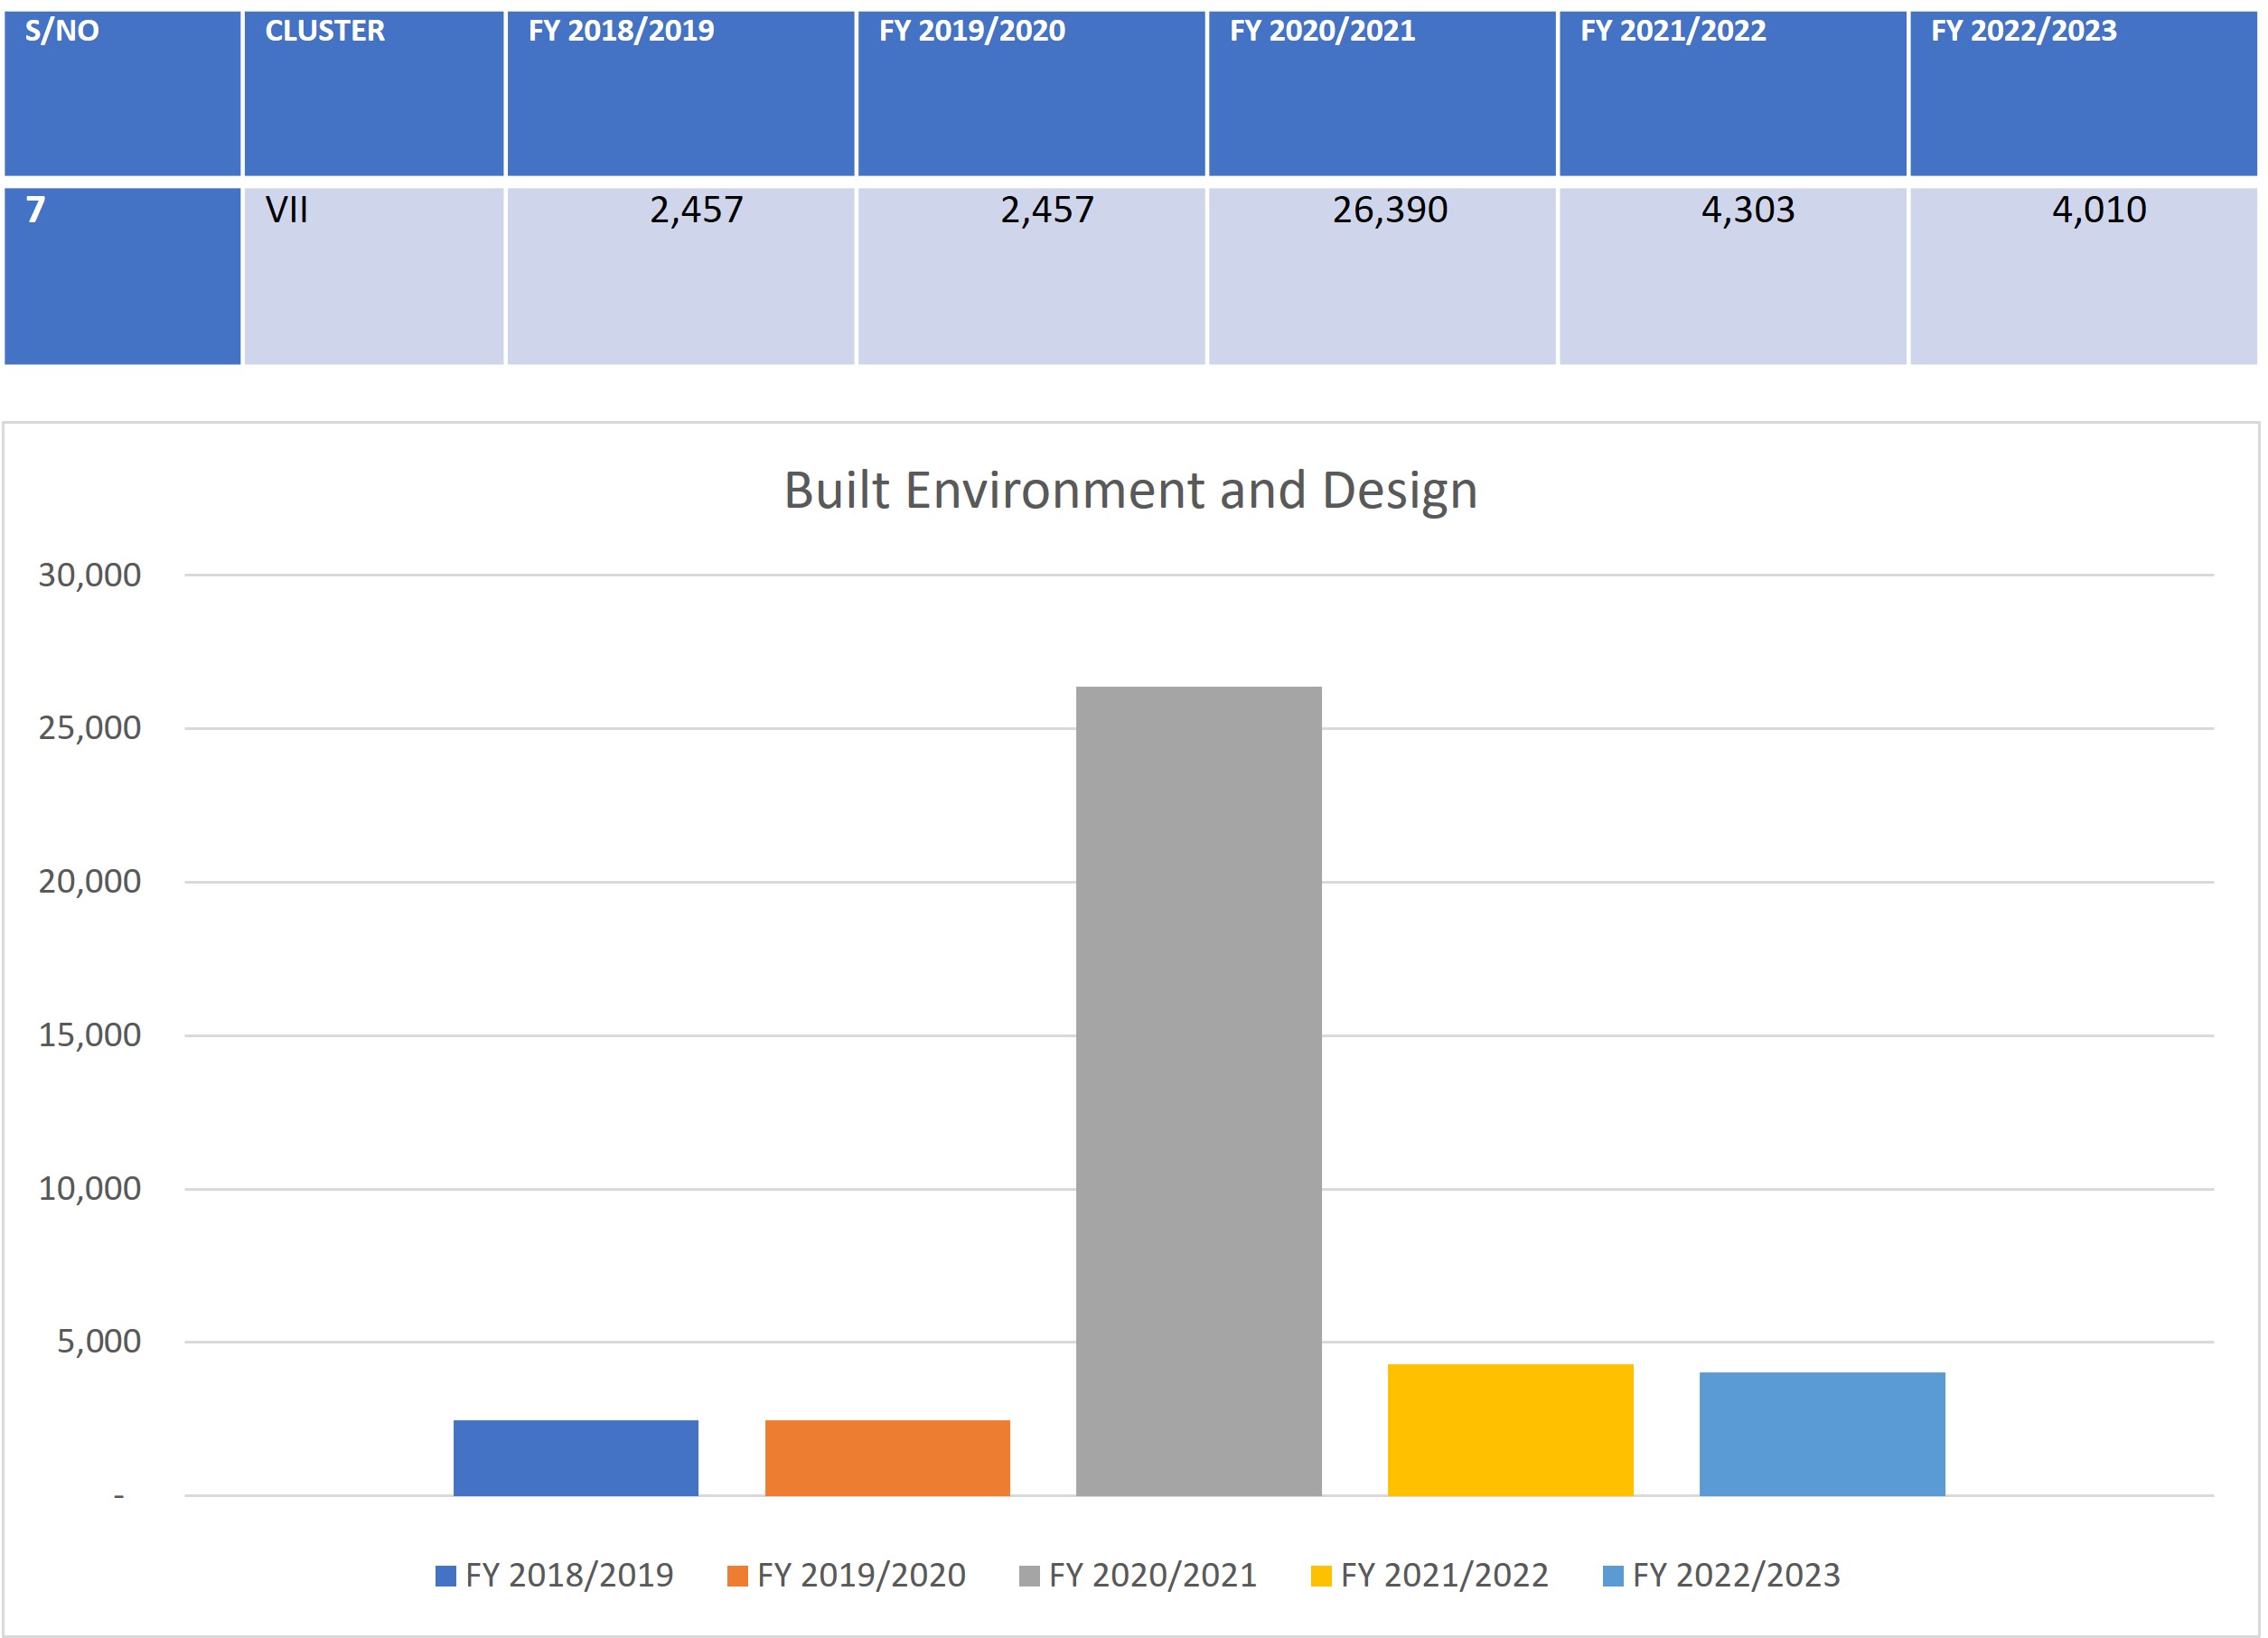
Graph 7 shows distribution of student numbers in Build Environment and Design since the Financial Year (FY) 2018/2019 to FY 2022/2023. They include courses in Construction, Real Estate, Urban and Regional Planning, Landscape Architecture and Design.
S/NO | CLUSTER | FY 2018/2019 | FY 2019/2020 | FY 2020/2021 | FY 2021/2022 | FY 2022/2023 |
7 | VII | 2,457 | 2,457 | 26,390 | 4,303 | 4,010 |
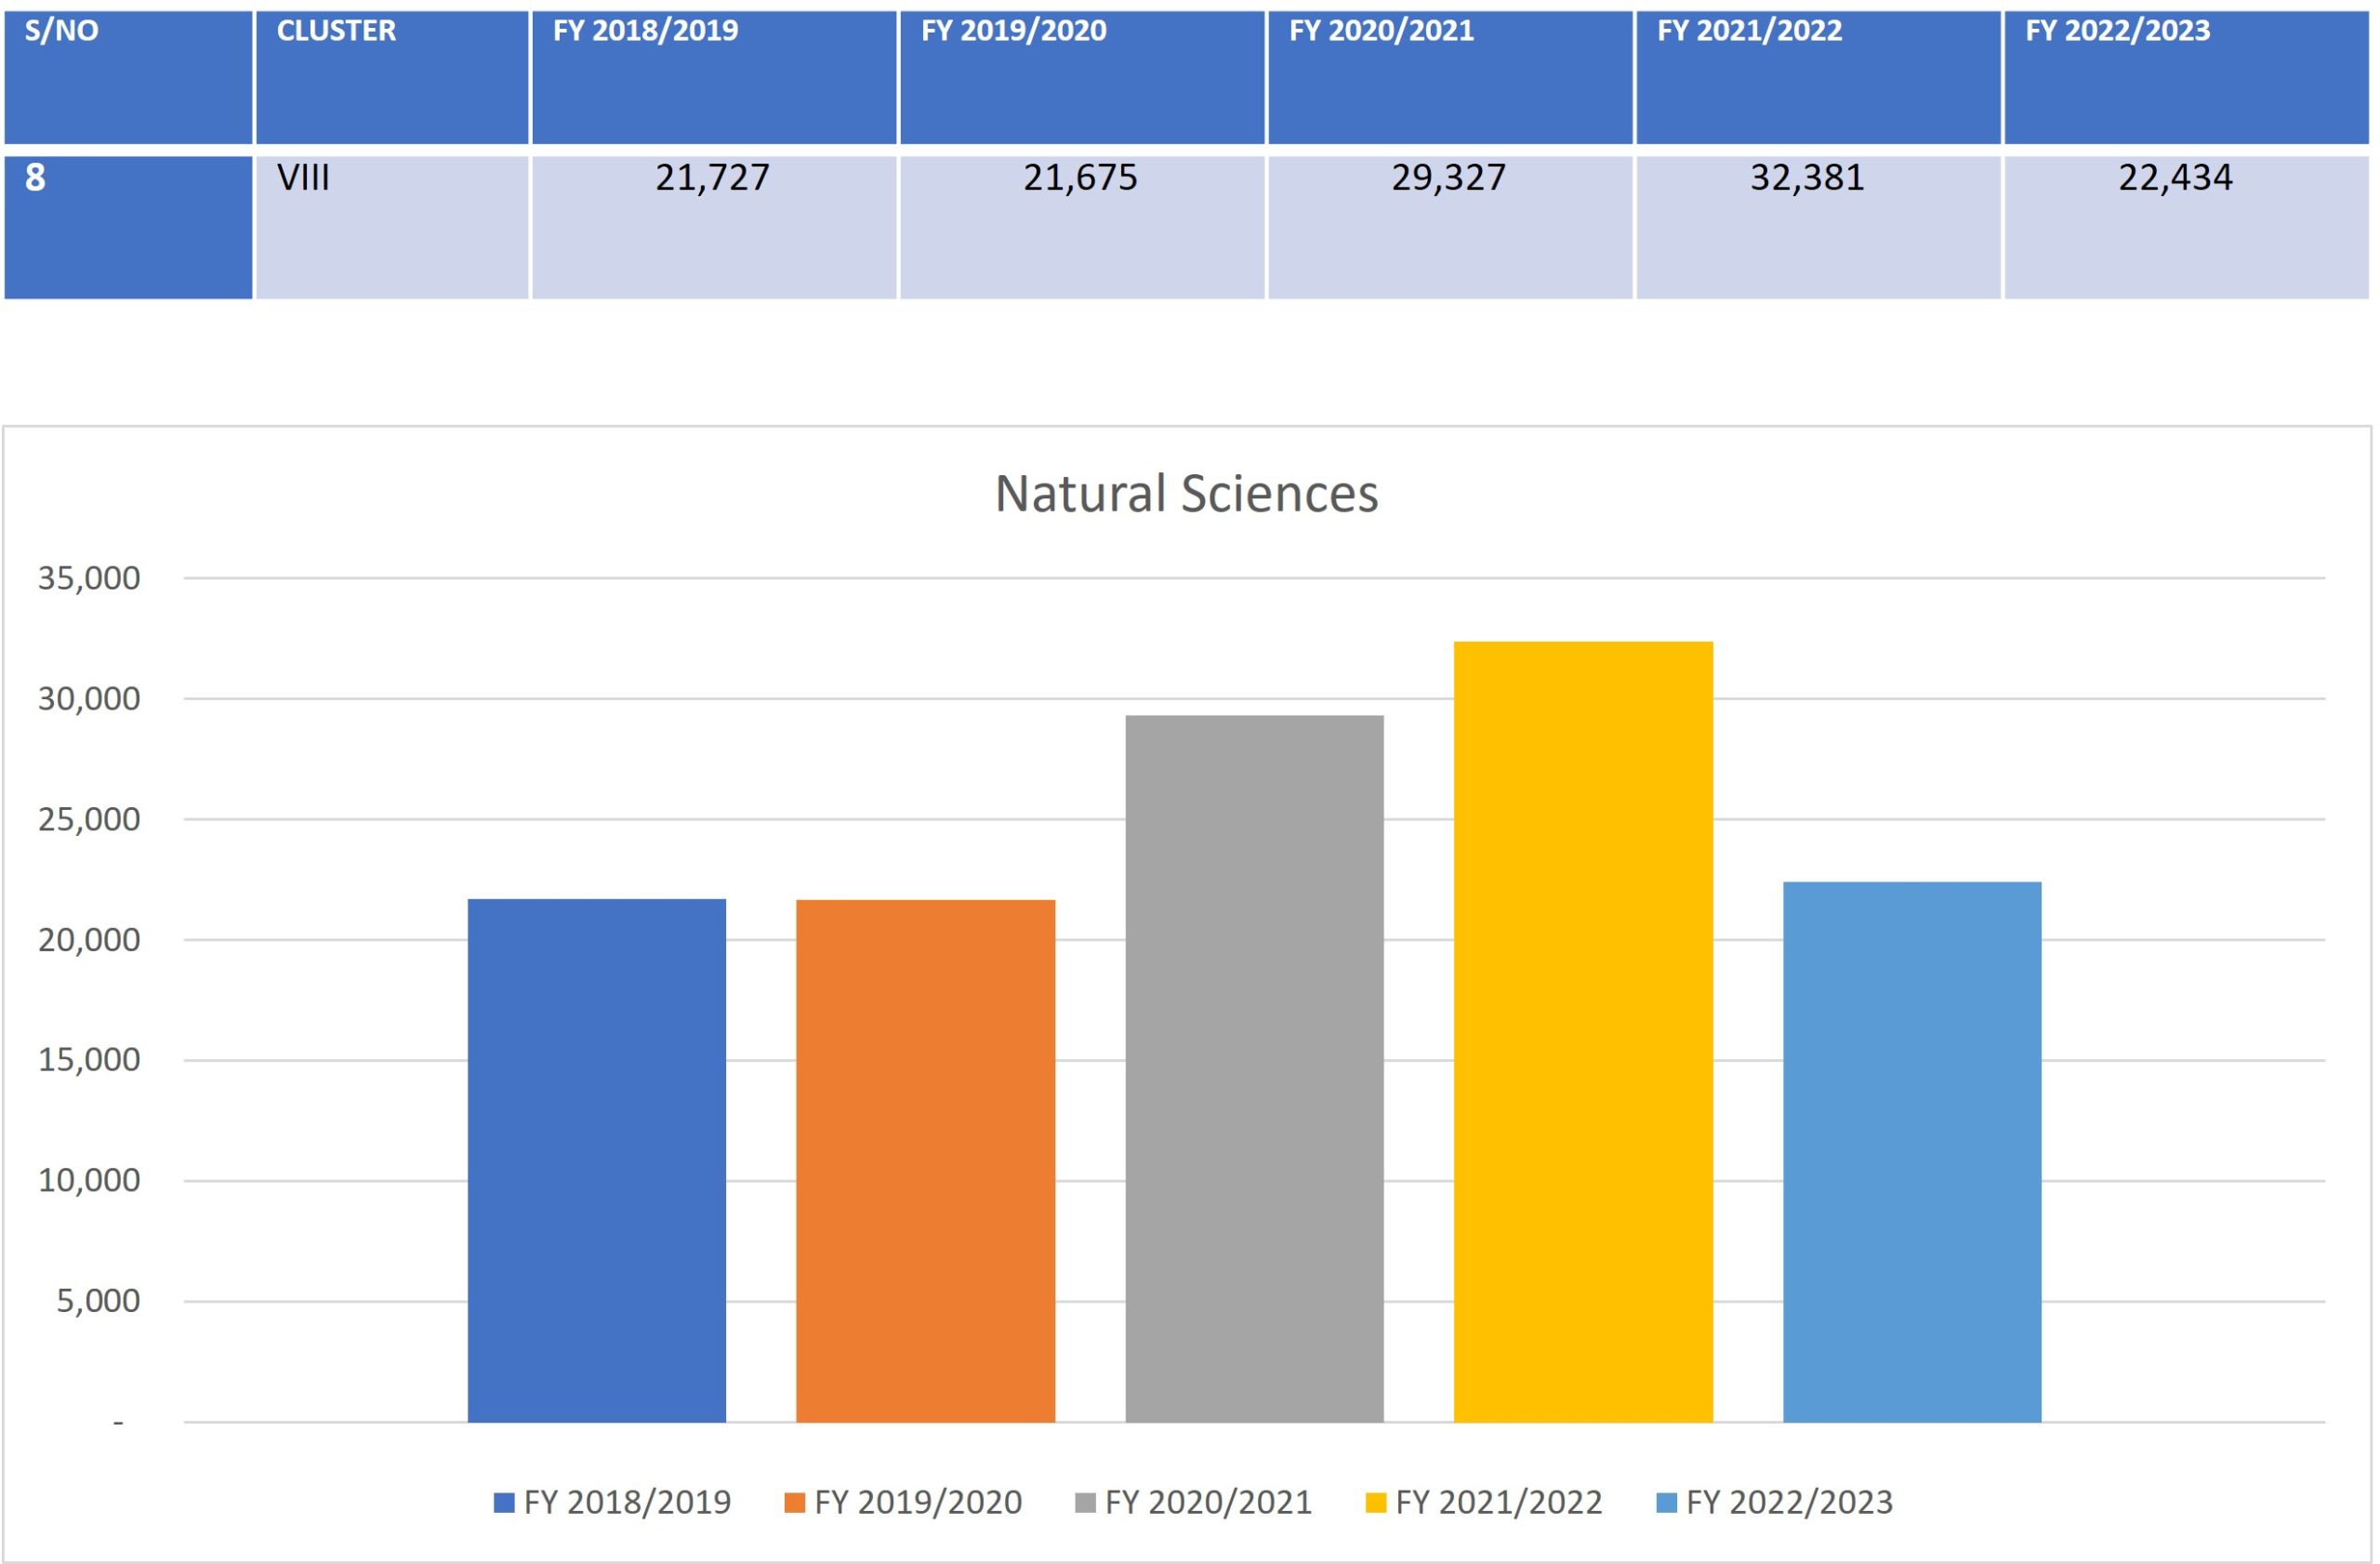
Graph 8 shows distribution of student numbers in Natural Sciences since the Financial Year (FY) 2018/2019 to FY 2022/2023. They include courses in Agriculture, Health Sciences, Food Sciences, Natural Resource Management and the Natural Environment, Food Science and Technology, Medical Laboratory Science and Technology, Animal Science, Nursing, Clinical Medicine (BSc.), Radiography, Foods and Nutrition, Medical Psychology, Physical therapy, Public Health, Environmental Health, Community Health and Development, Wildlife Science and Management, Agribusiness Management.
S/NO | CLUSTER | FY 2018/2019 | FY 2019/2020 | FY 2020/2021 | FY 2021/2022 | FY 2022/2023 |
8 | VIII | 21,727 | 21,675 | 29,327 | 32,381 | 22,434 |
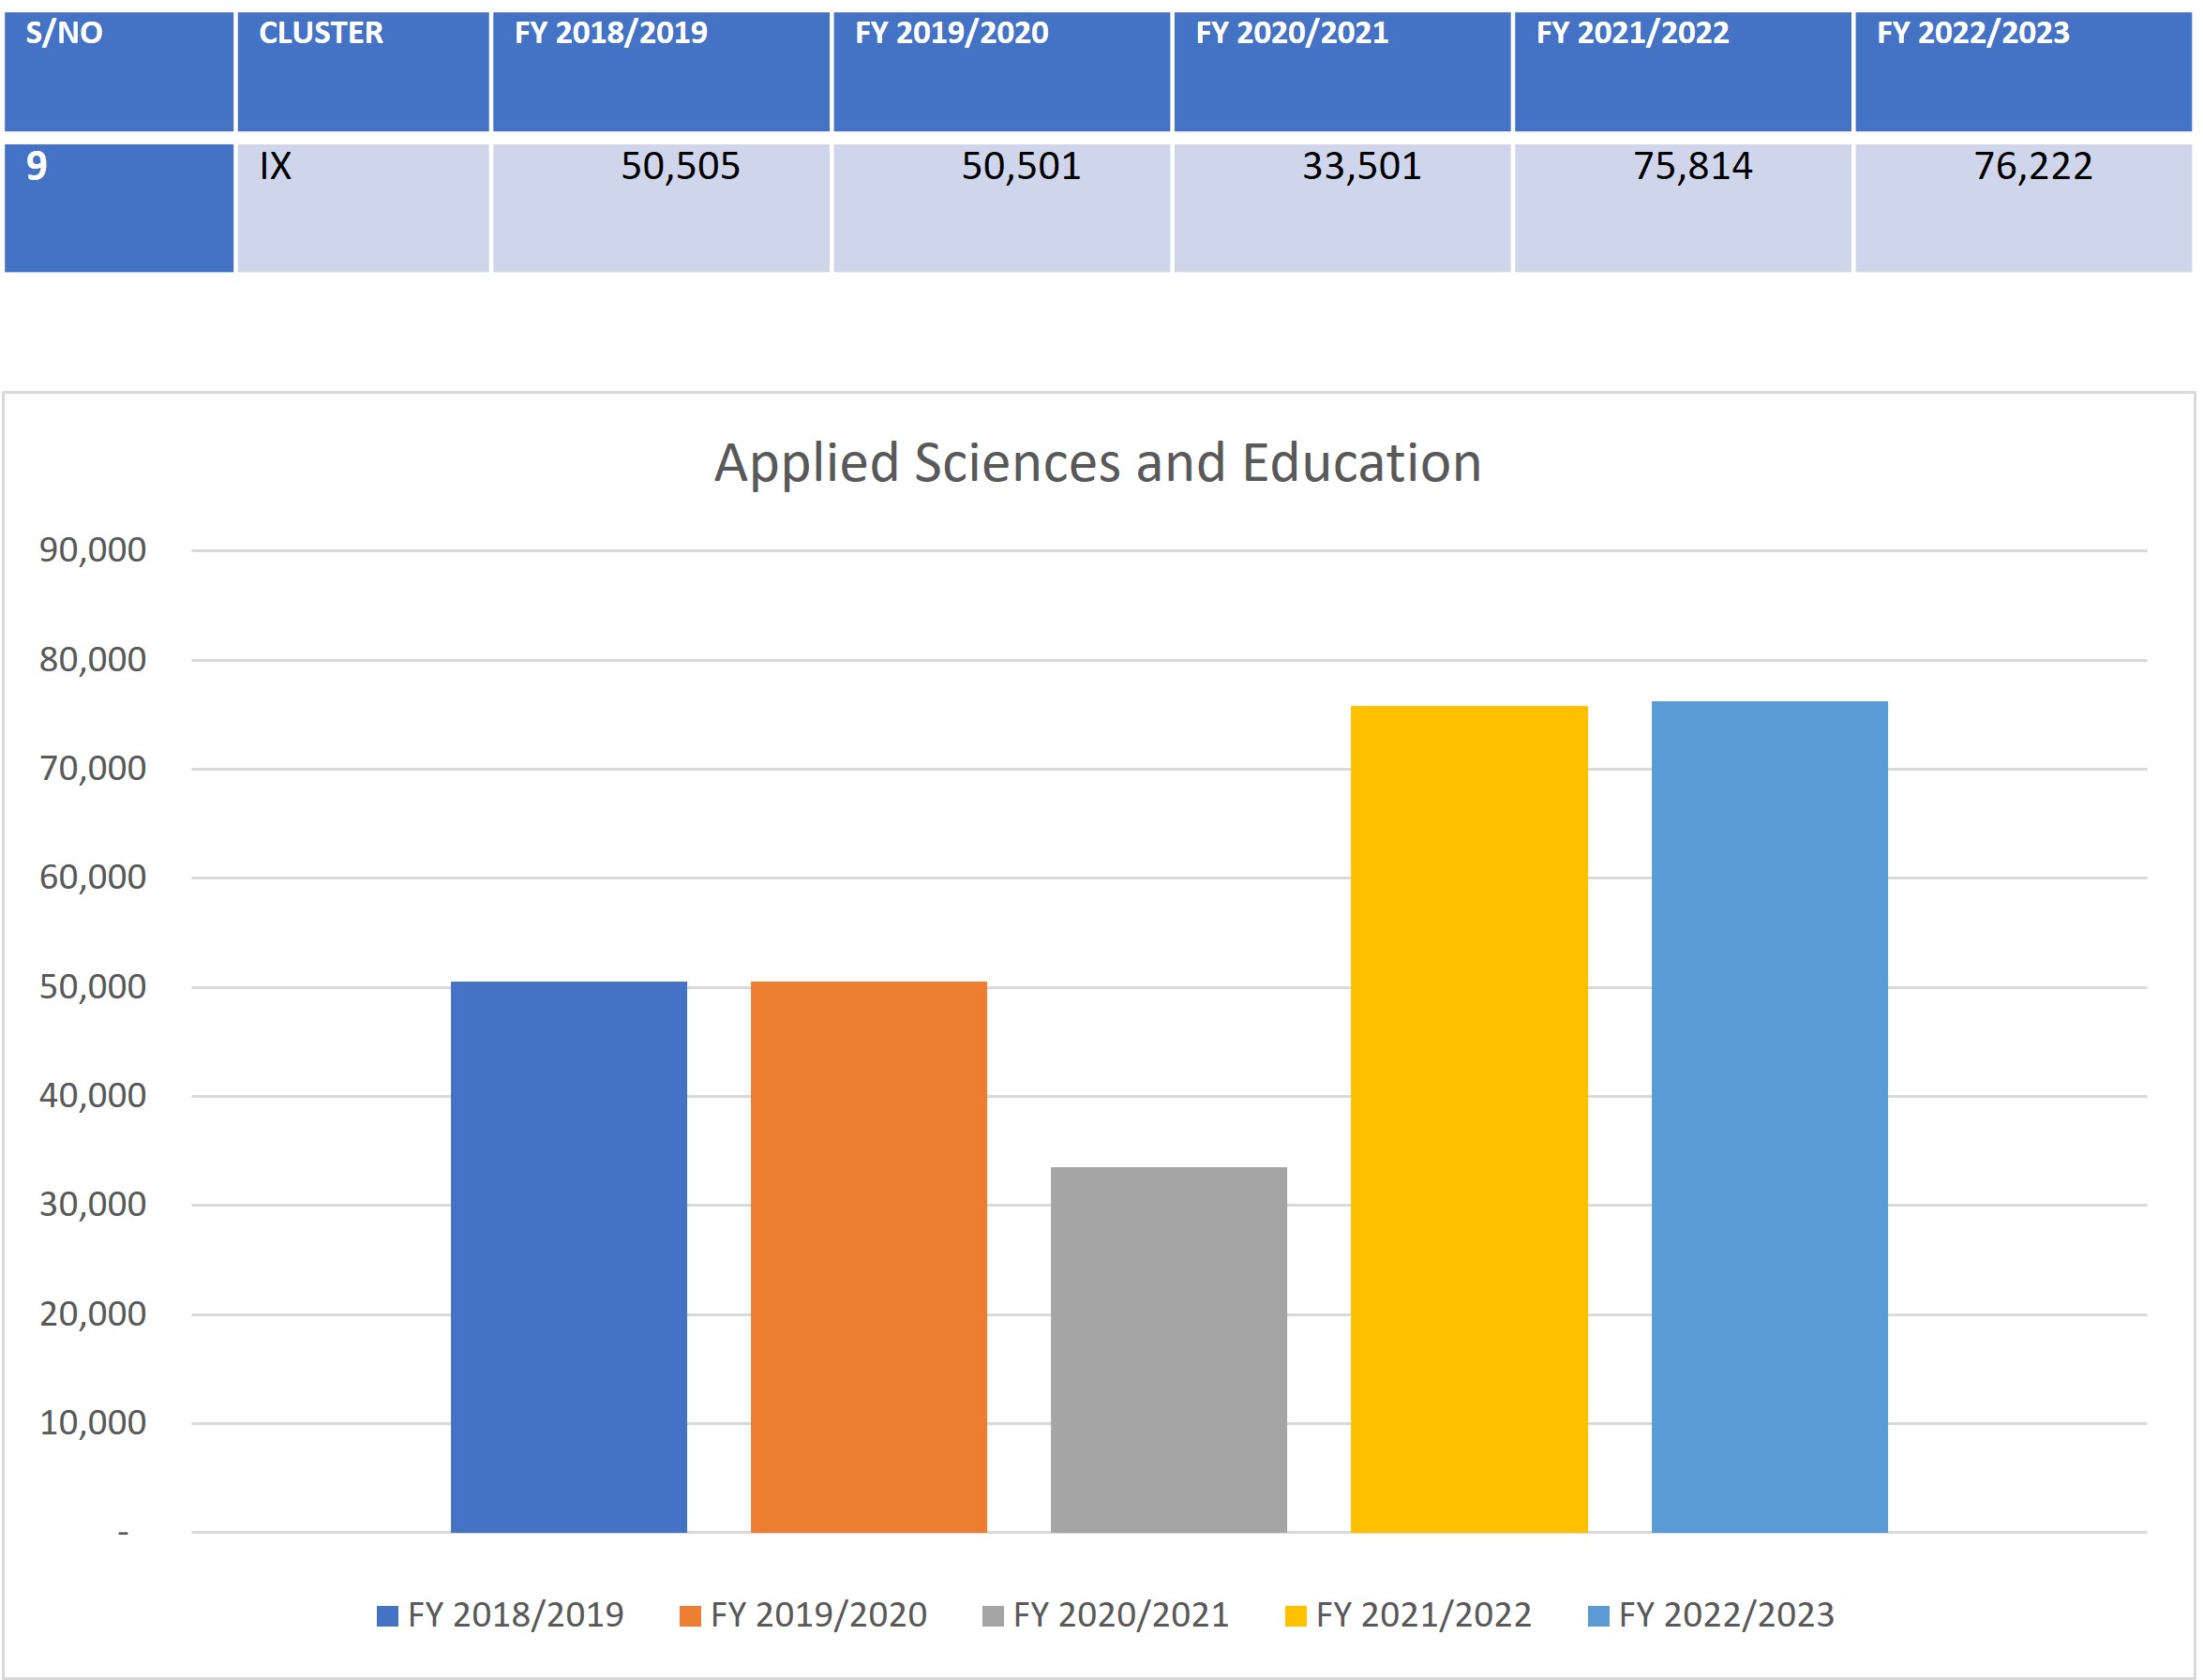
Graph 9 shows distribution of student numbers in Applied Sciences and Education since the Financial Year (FY) 2018/2019 to FY 2022/2023. They include courses in - Education (Science,Technology & Special Needs), Biochemistry, Biotechnology, Biomedical Sciences, Applied Microbiology and Molecular Biology, Applied and Technical Physics, Applied and Technical Chemistry, Applied and Technical Biology, Statistics, Actuarial Science, Financial Engineering and Environmental Science.
S/NO | CLUSTER | FY 2018/2019 | FY 2019/2020 | FY 2020/2021 | FY 2021/2022 | FY 2022/2023 |
9 | IX | 50,505 | 50,501 | 33,501 | 75,814 | 76,222 |
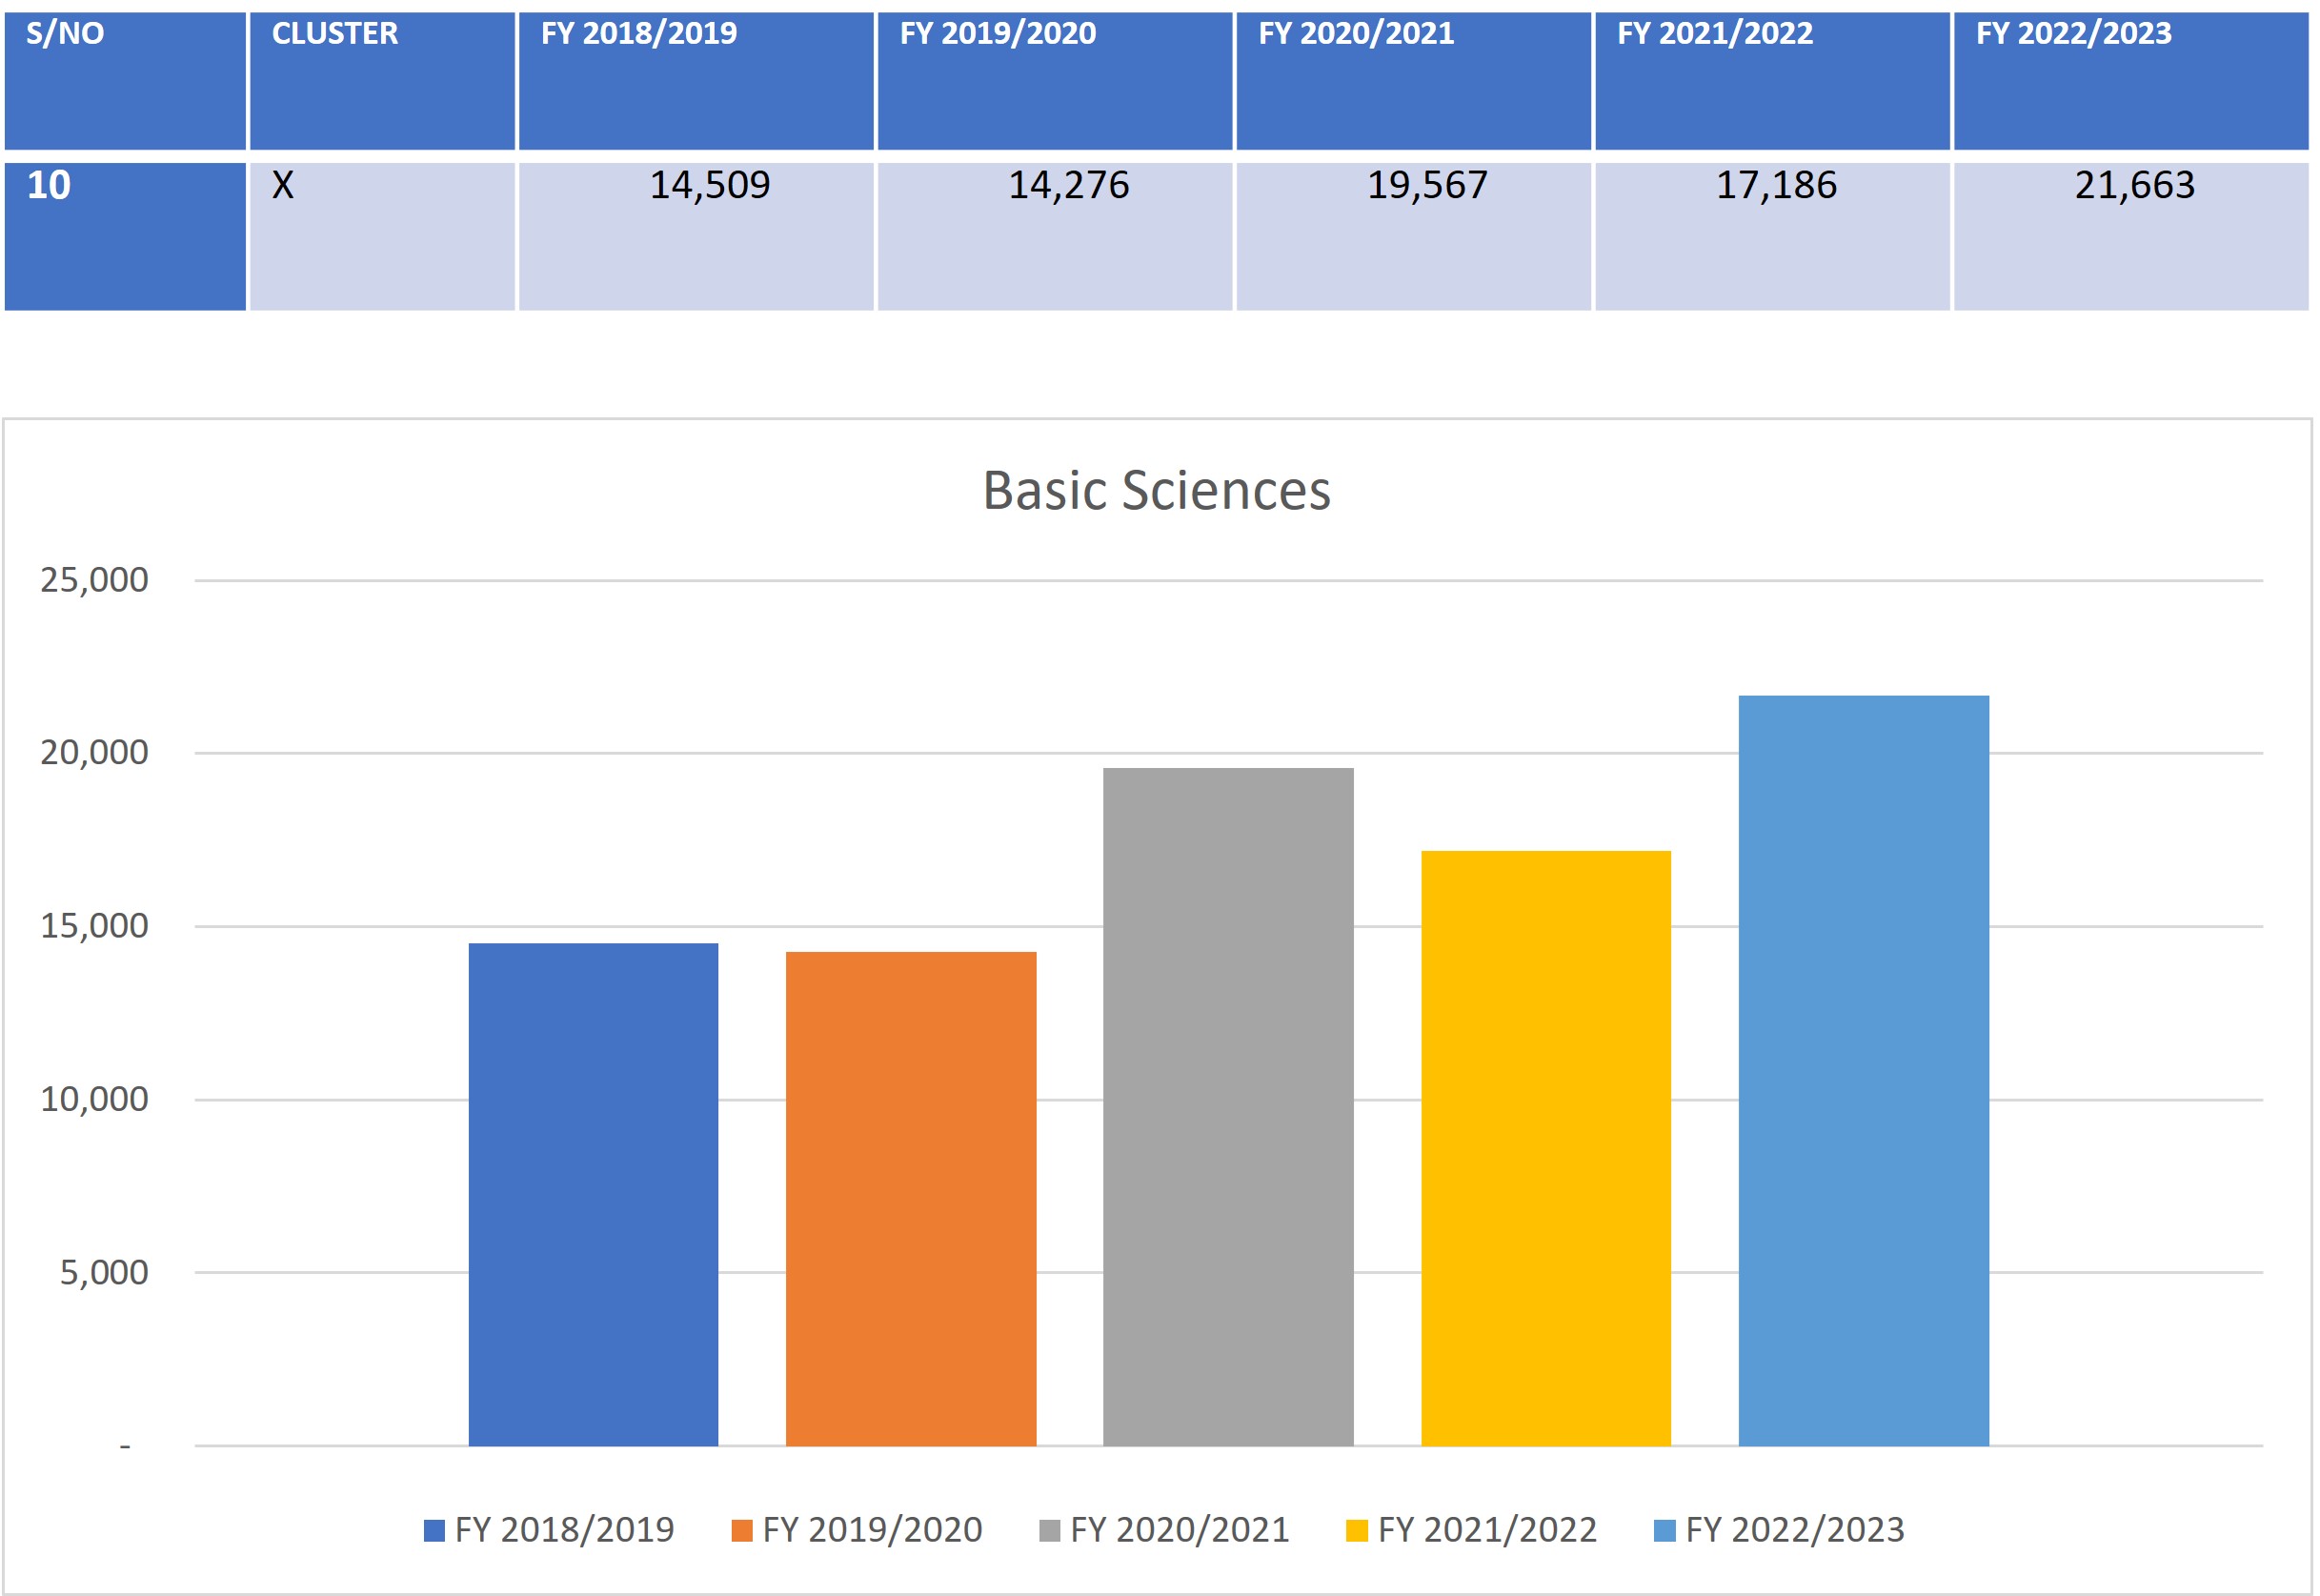
Graph 10 shows distribution of student numbers in Basic Sciences since the Financial Year (FY) 2018/2019 to FY 2022/2023. They include courses in Bachelor of Science in Mathematics, Physics, Chemistry, Biology and Geography.
S/NO | CLUSTER | FY 2018/2019 | FY 2019/2020 | FY 2020/2021 | FY 2021/2022 | FY 2022/2023 |
10 | X | 14,509 | 14,276 | 19,567 | 17,186 | 21,663 |
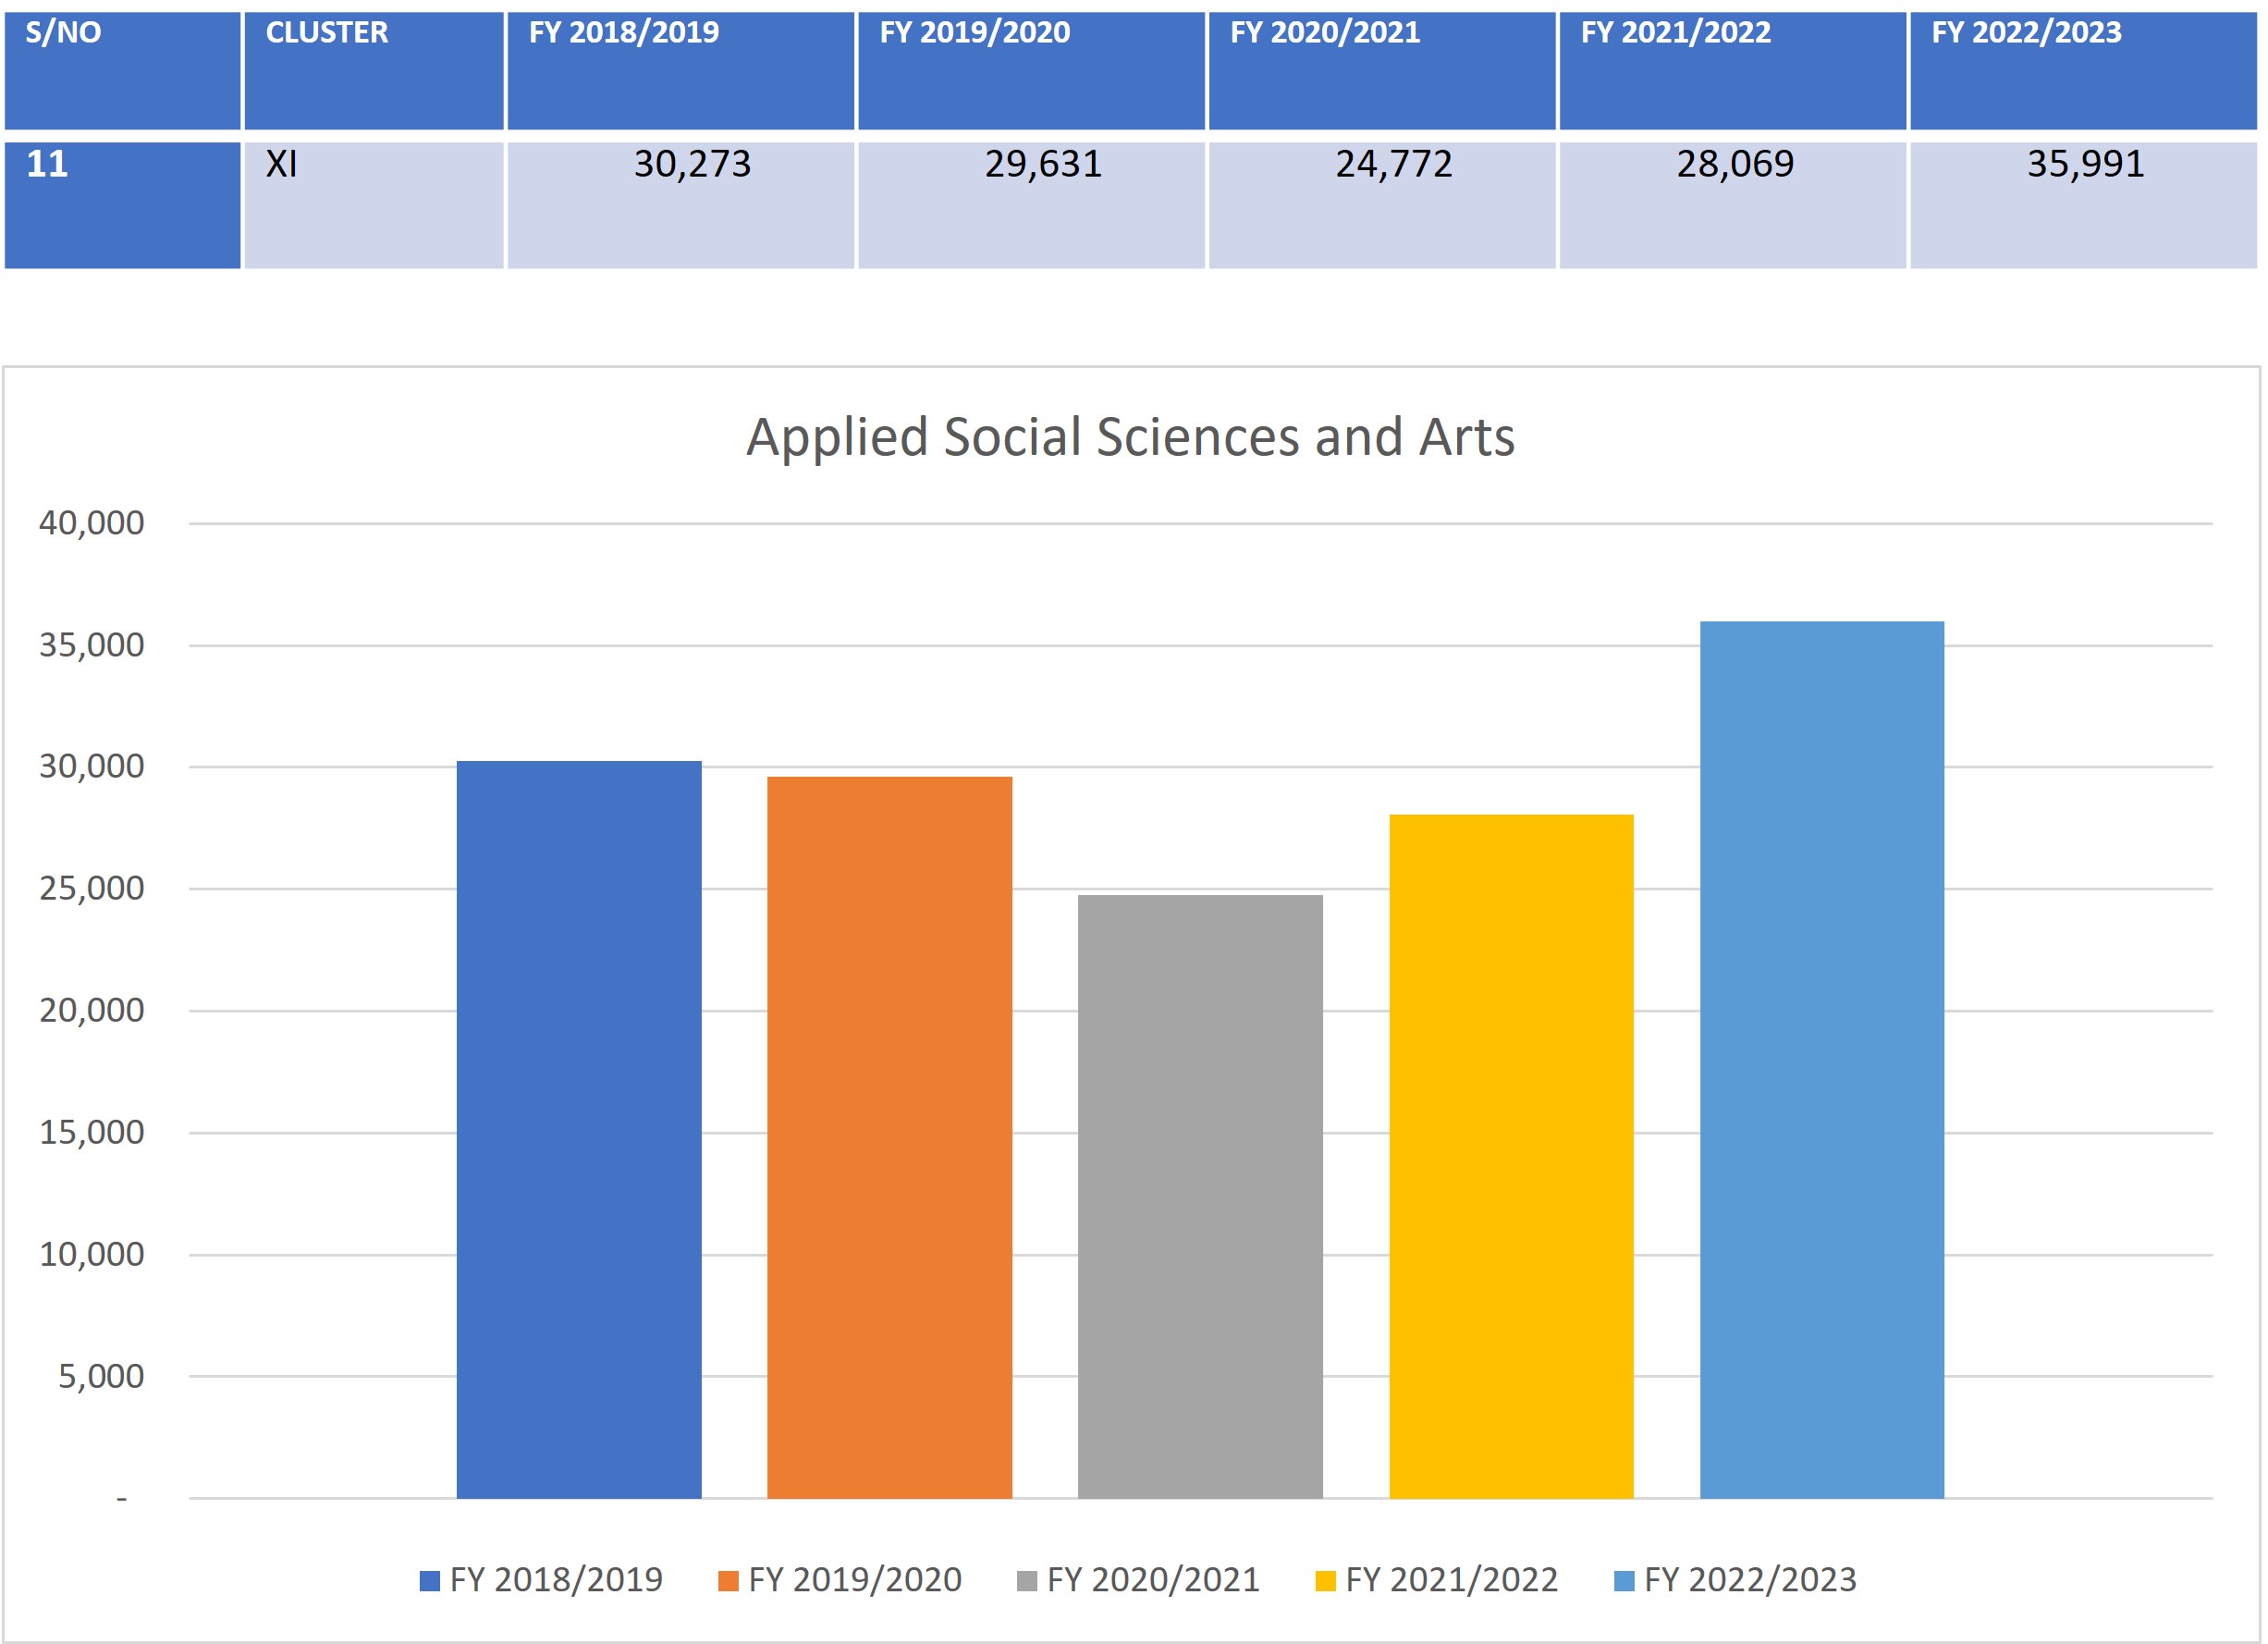
Graph 11 shows distribution of student numbers in Applied Sciences and Arts since the Financial Year (FY) 2018/2019 to FY 2022/2023. They include courses in Hospitality, Media and Communication Studies, Library and Information Studies, Business Information Technology, Sport Science and Management, Fashion Design, Interior Design, Music (B.Mus.), Civil Aviation Management, Maritime Management, Agribusiness Management, Theatre and Film Studies, Fine Art, Food Service and Management.
S/NO | CLUSTER | FY 2018/2019 | FY 2019/2020 | FY 2020/2021 | FY 2021/2022 | FY 2022/2023 |
11 | XI | 30,273 | 29,631 | 24,772 | 28,069 | 35,991 |
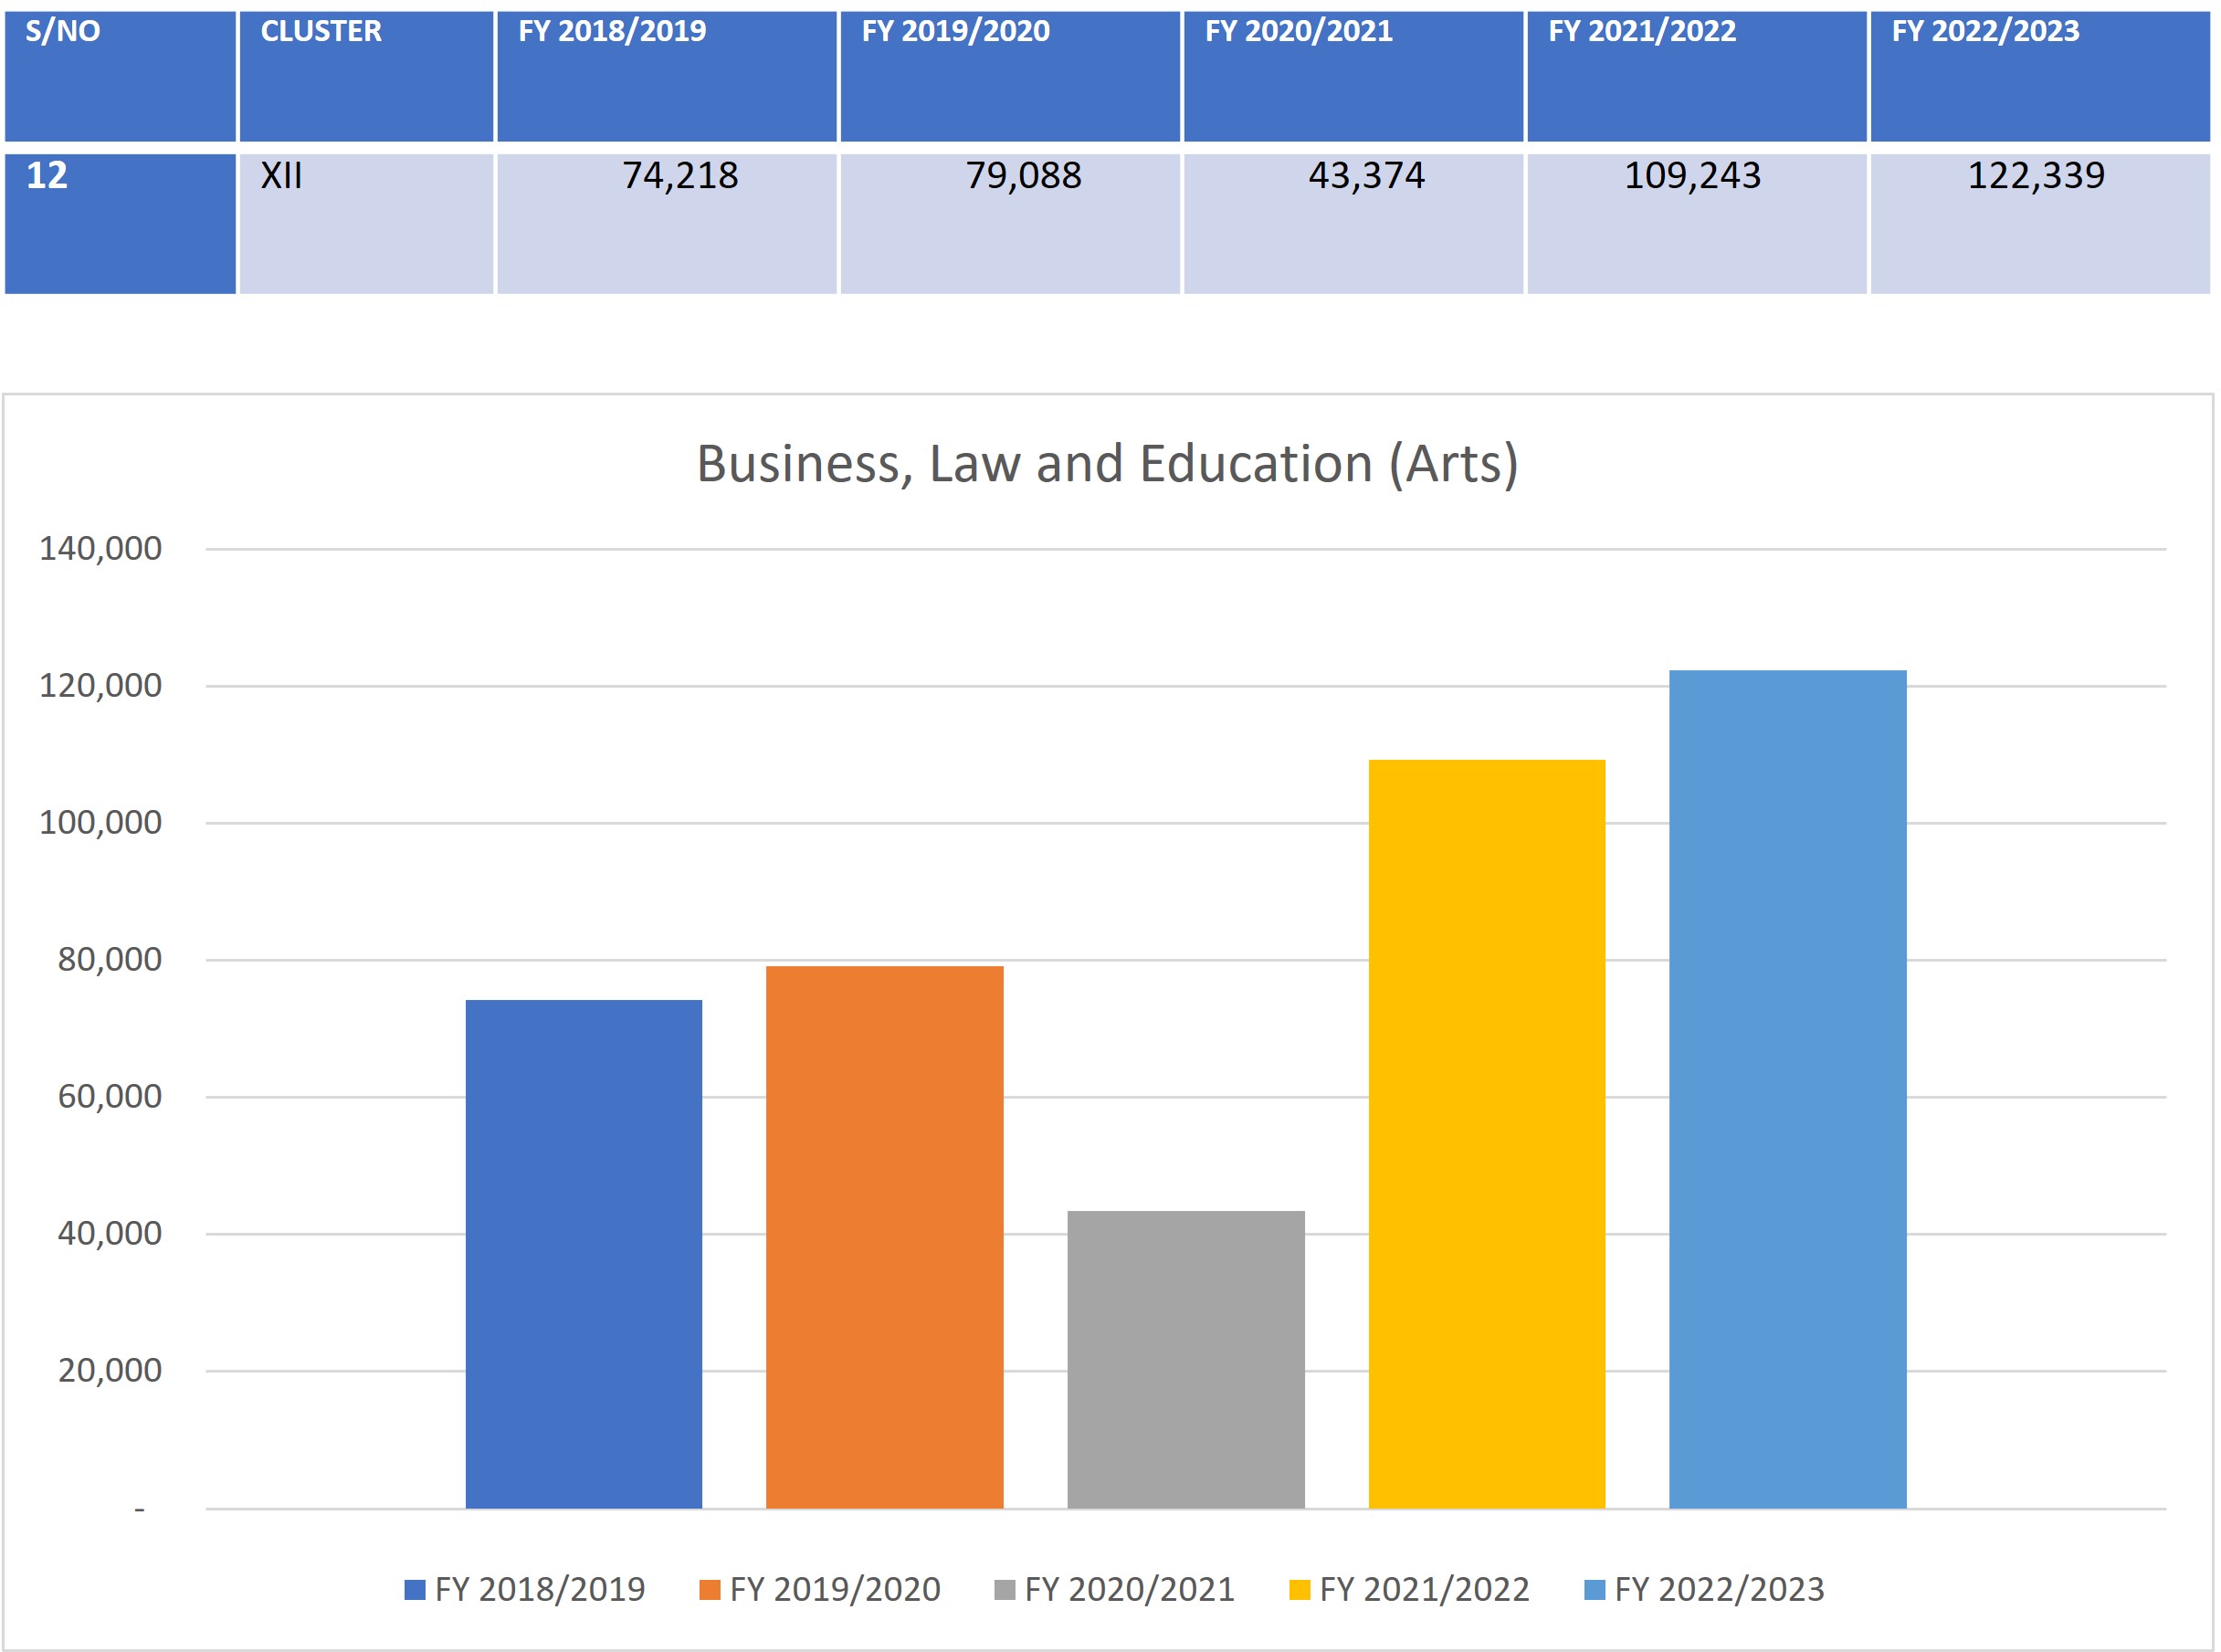
Graph 12 shows distribution of student numbers in Business, Law and Education (Arts) since the Financial Year (FY) 2018/2019 to FY 2022/2023. The include courses in Business, Law, Education (Arts) and Economics.
S/NO | CLUSTER | FY 2018/2019 | FY 2019/2020 | FY 2020/2021 | FY 2021/2022 | FY 2022/2023 |
12 | XII | 74,218 | 79,088 | 43,374 | 109,243 | 122,339 |
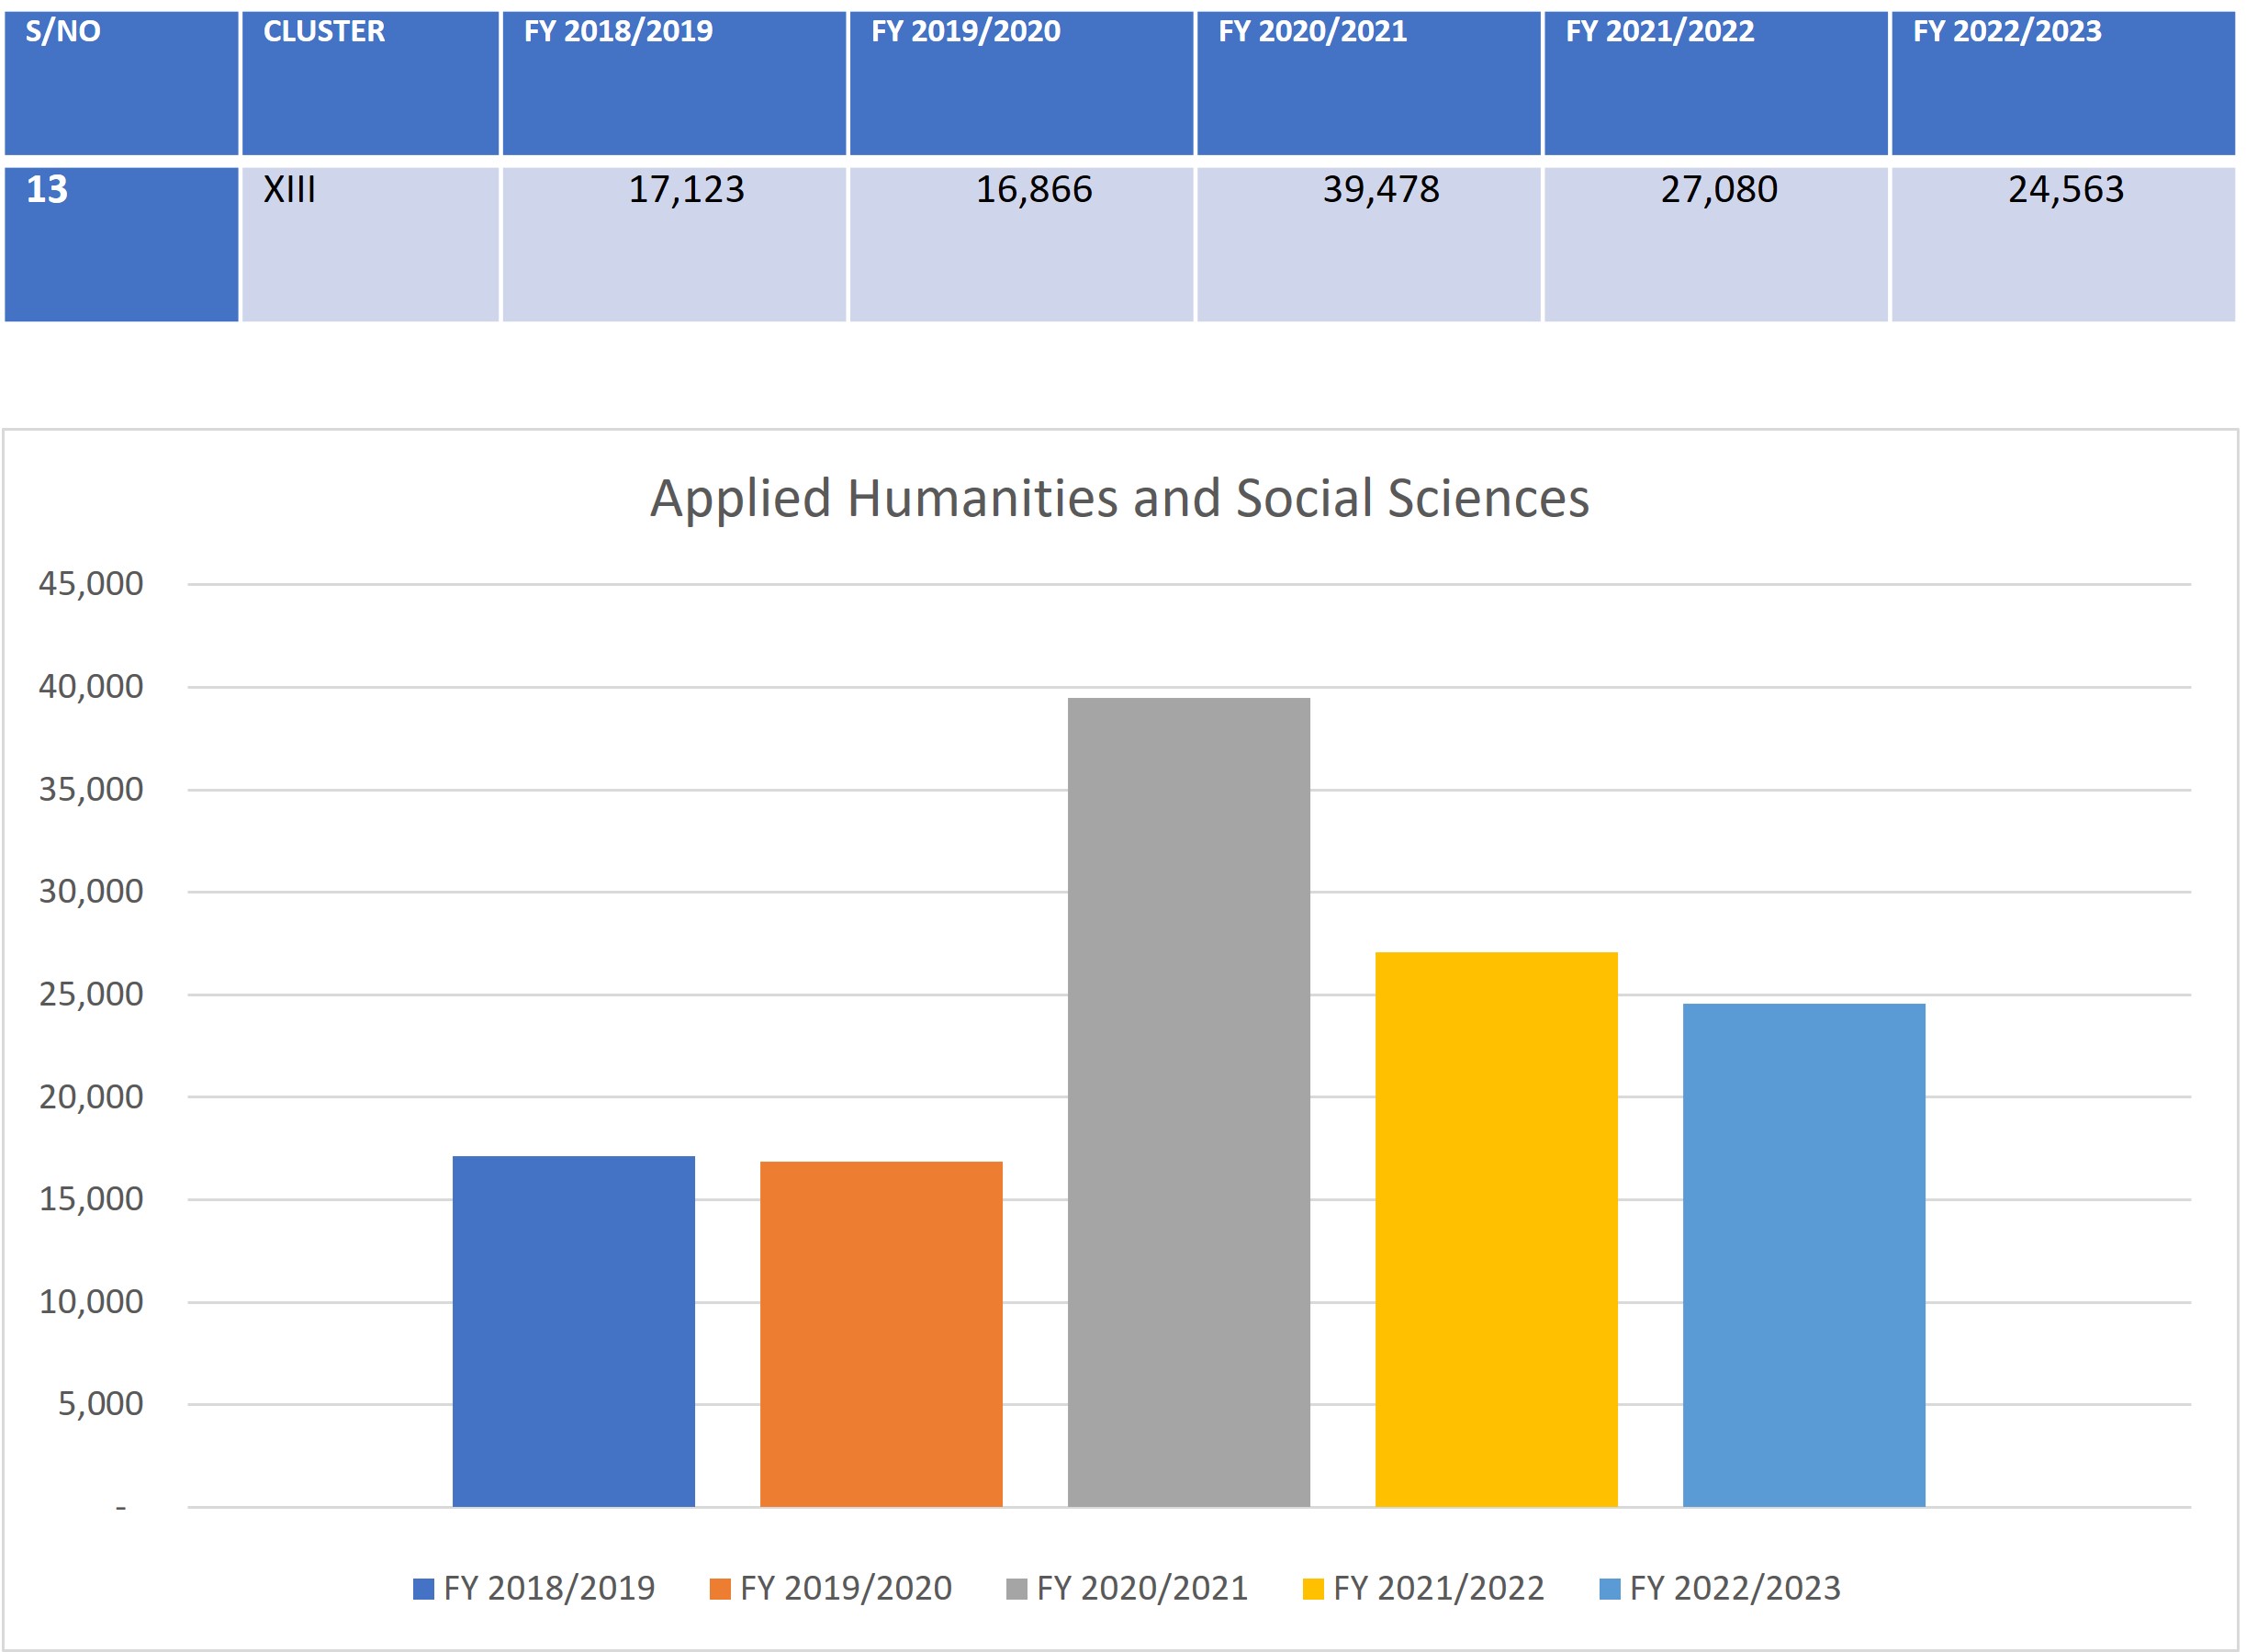
Graph 13 shows distribution of student numbers in Applied Humanities and Social Sciences since the Financial Year (FY) 2018/2019 to FY 2022/2023. They include courses in Geography (B.A.), Public Administration, Psychology, Peace and Security Studies, Disaster Management, Anthropology, Languages, Language and Communication, International Relations and Diplomacy, social work and Development Studies.
S/NO | CLUSTER | FY 2018/2019 | FY 2019/2020 | FY 2020/2021 | FY 2021/2022 | FY 2022/2023 |
13 | XIII | 17,123 | 16,866 | 39,478 | 27,080 | 24,563 |
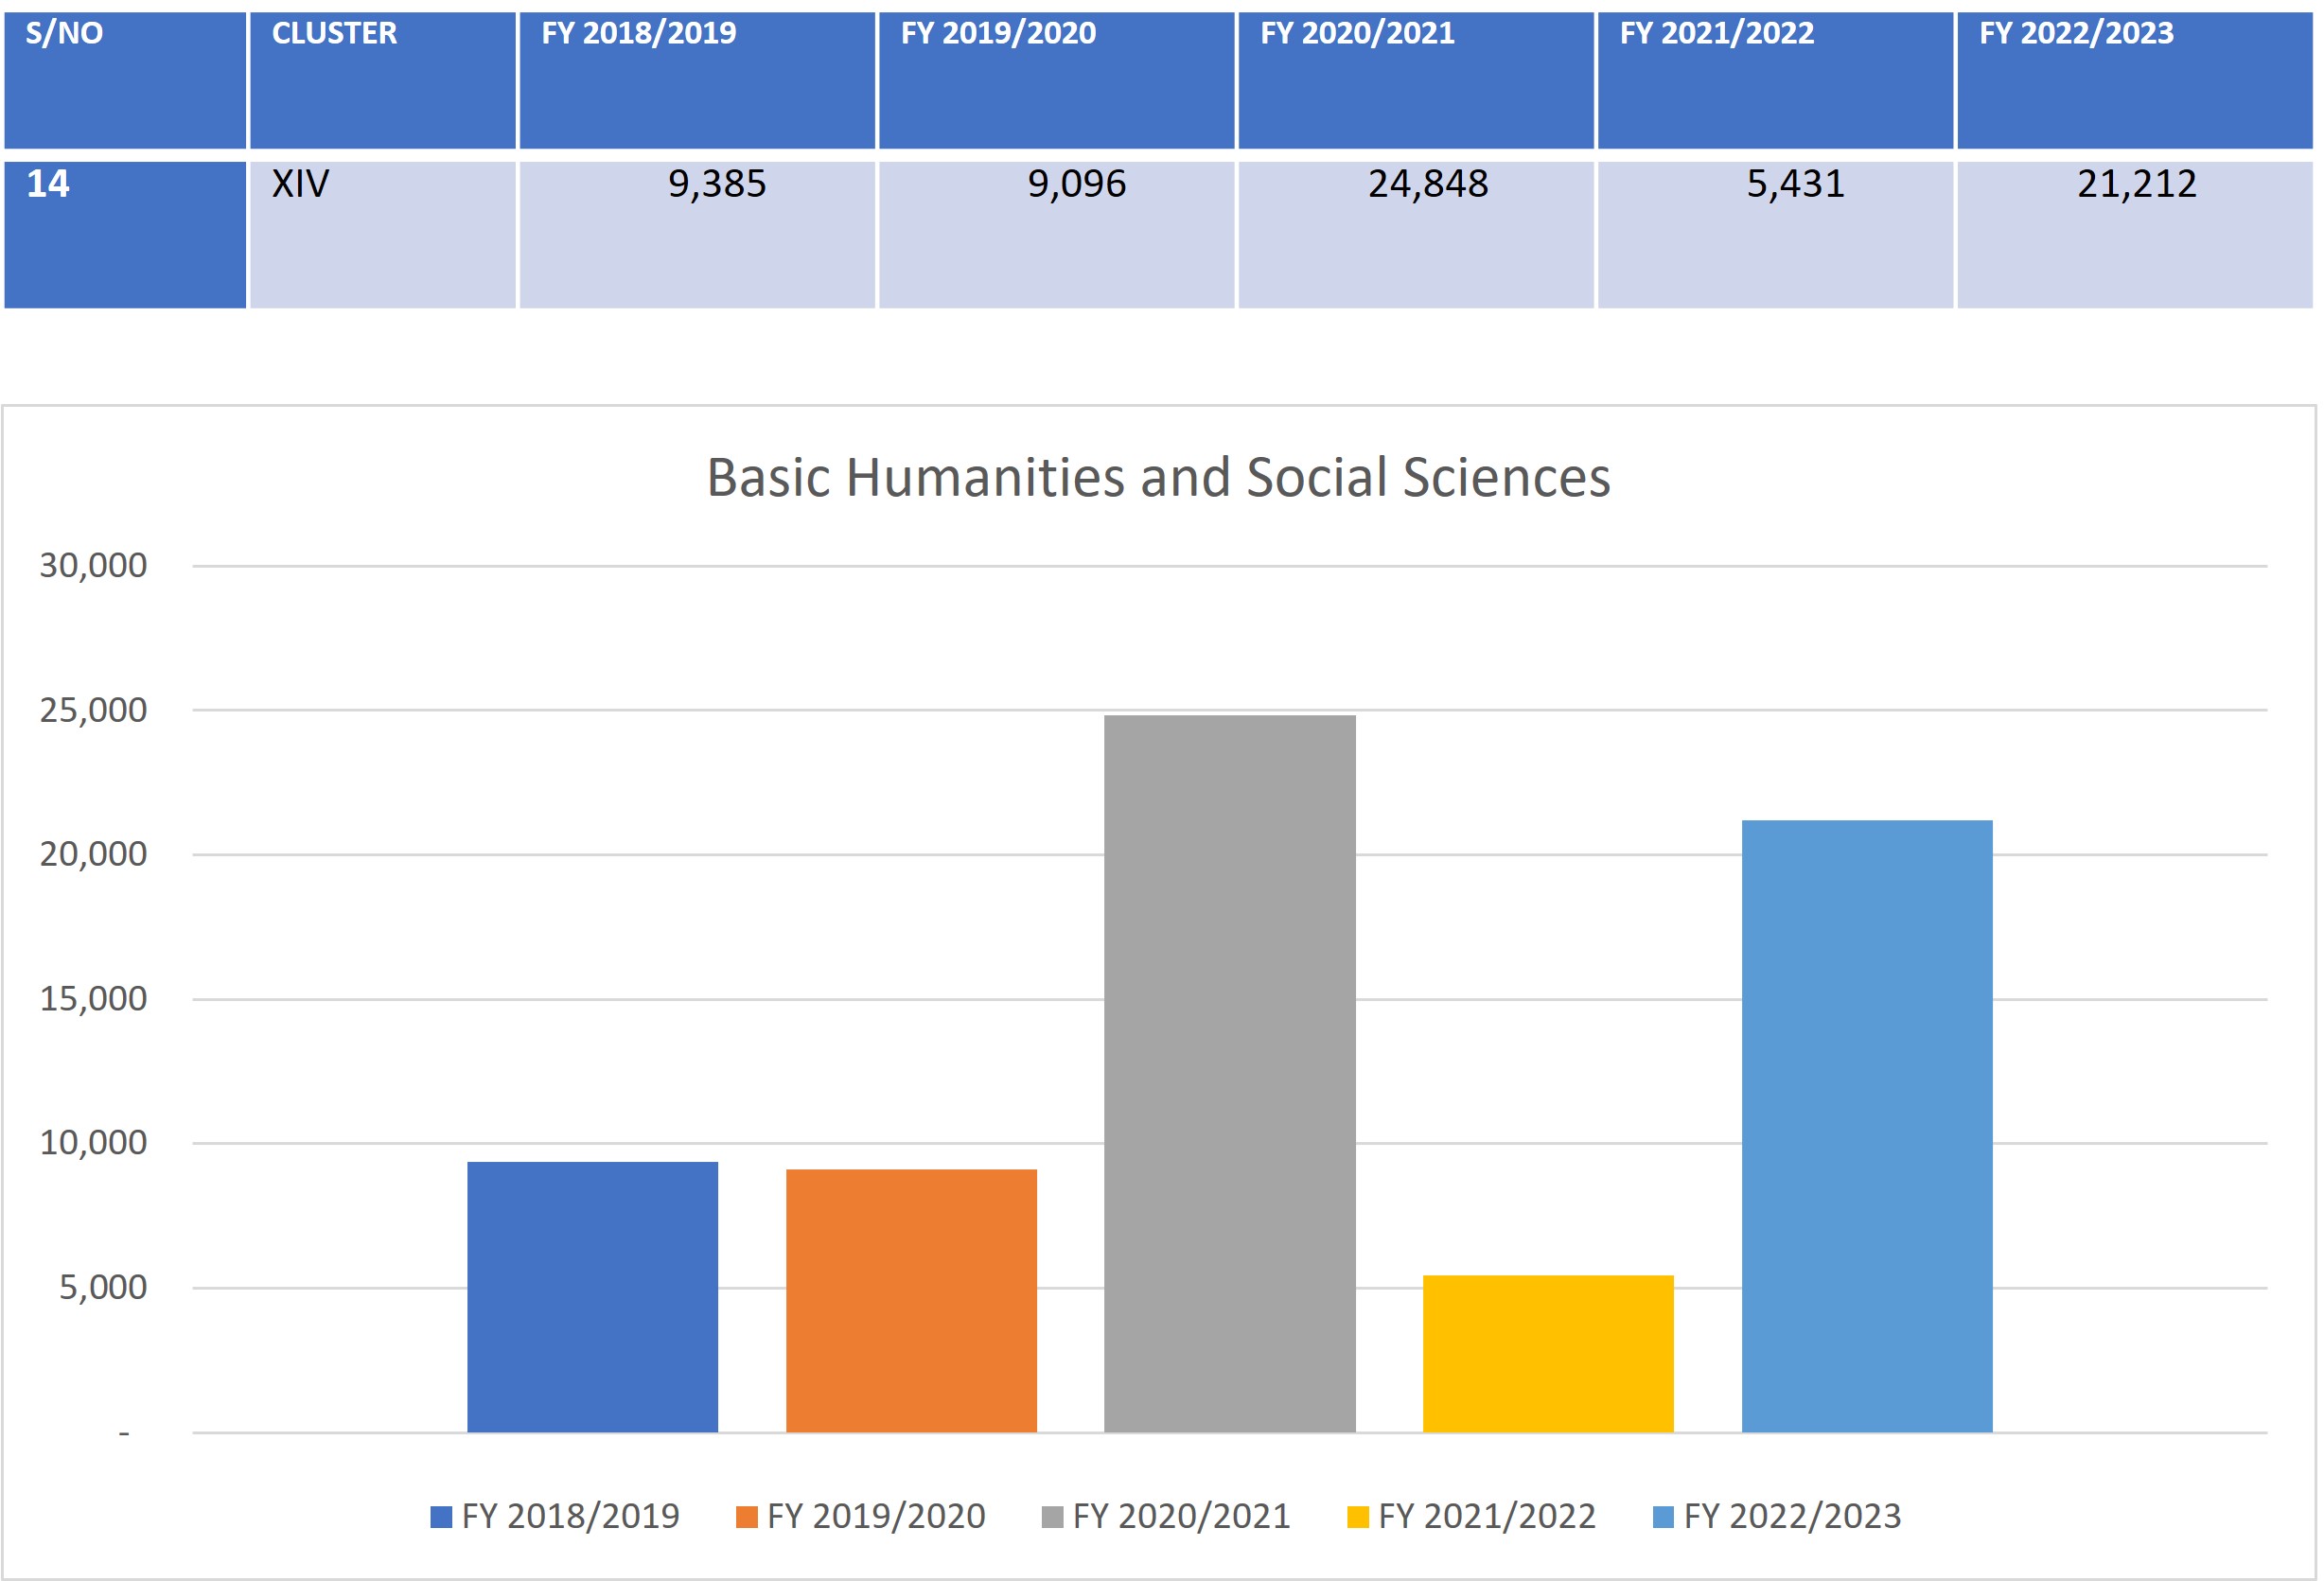
Graph 14 shows distribution of student numbers in Basic Humanities and Social Sciences since the Financial Year (FY) 2018/2019 to FY 2022/2023. They include courses in History, Philosophy, Religion, Sociology, Literature, Political Science and Linguistics.
S/NO | CLUSTER | FY 2018/2019 | FY 2019/2020 | FY 2020/2021 | FY 2021/2022 | FY 2022/2023 |
14 | XIV | 9,385 | 9,096 | 24,848 | 5,431 | 21,212 |
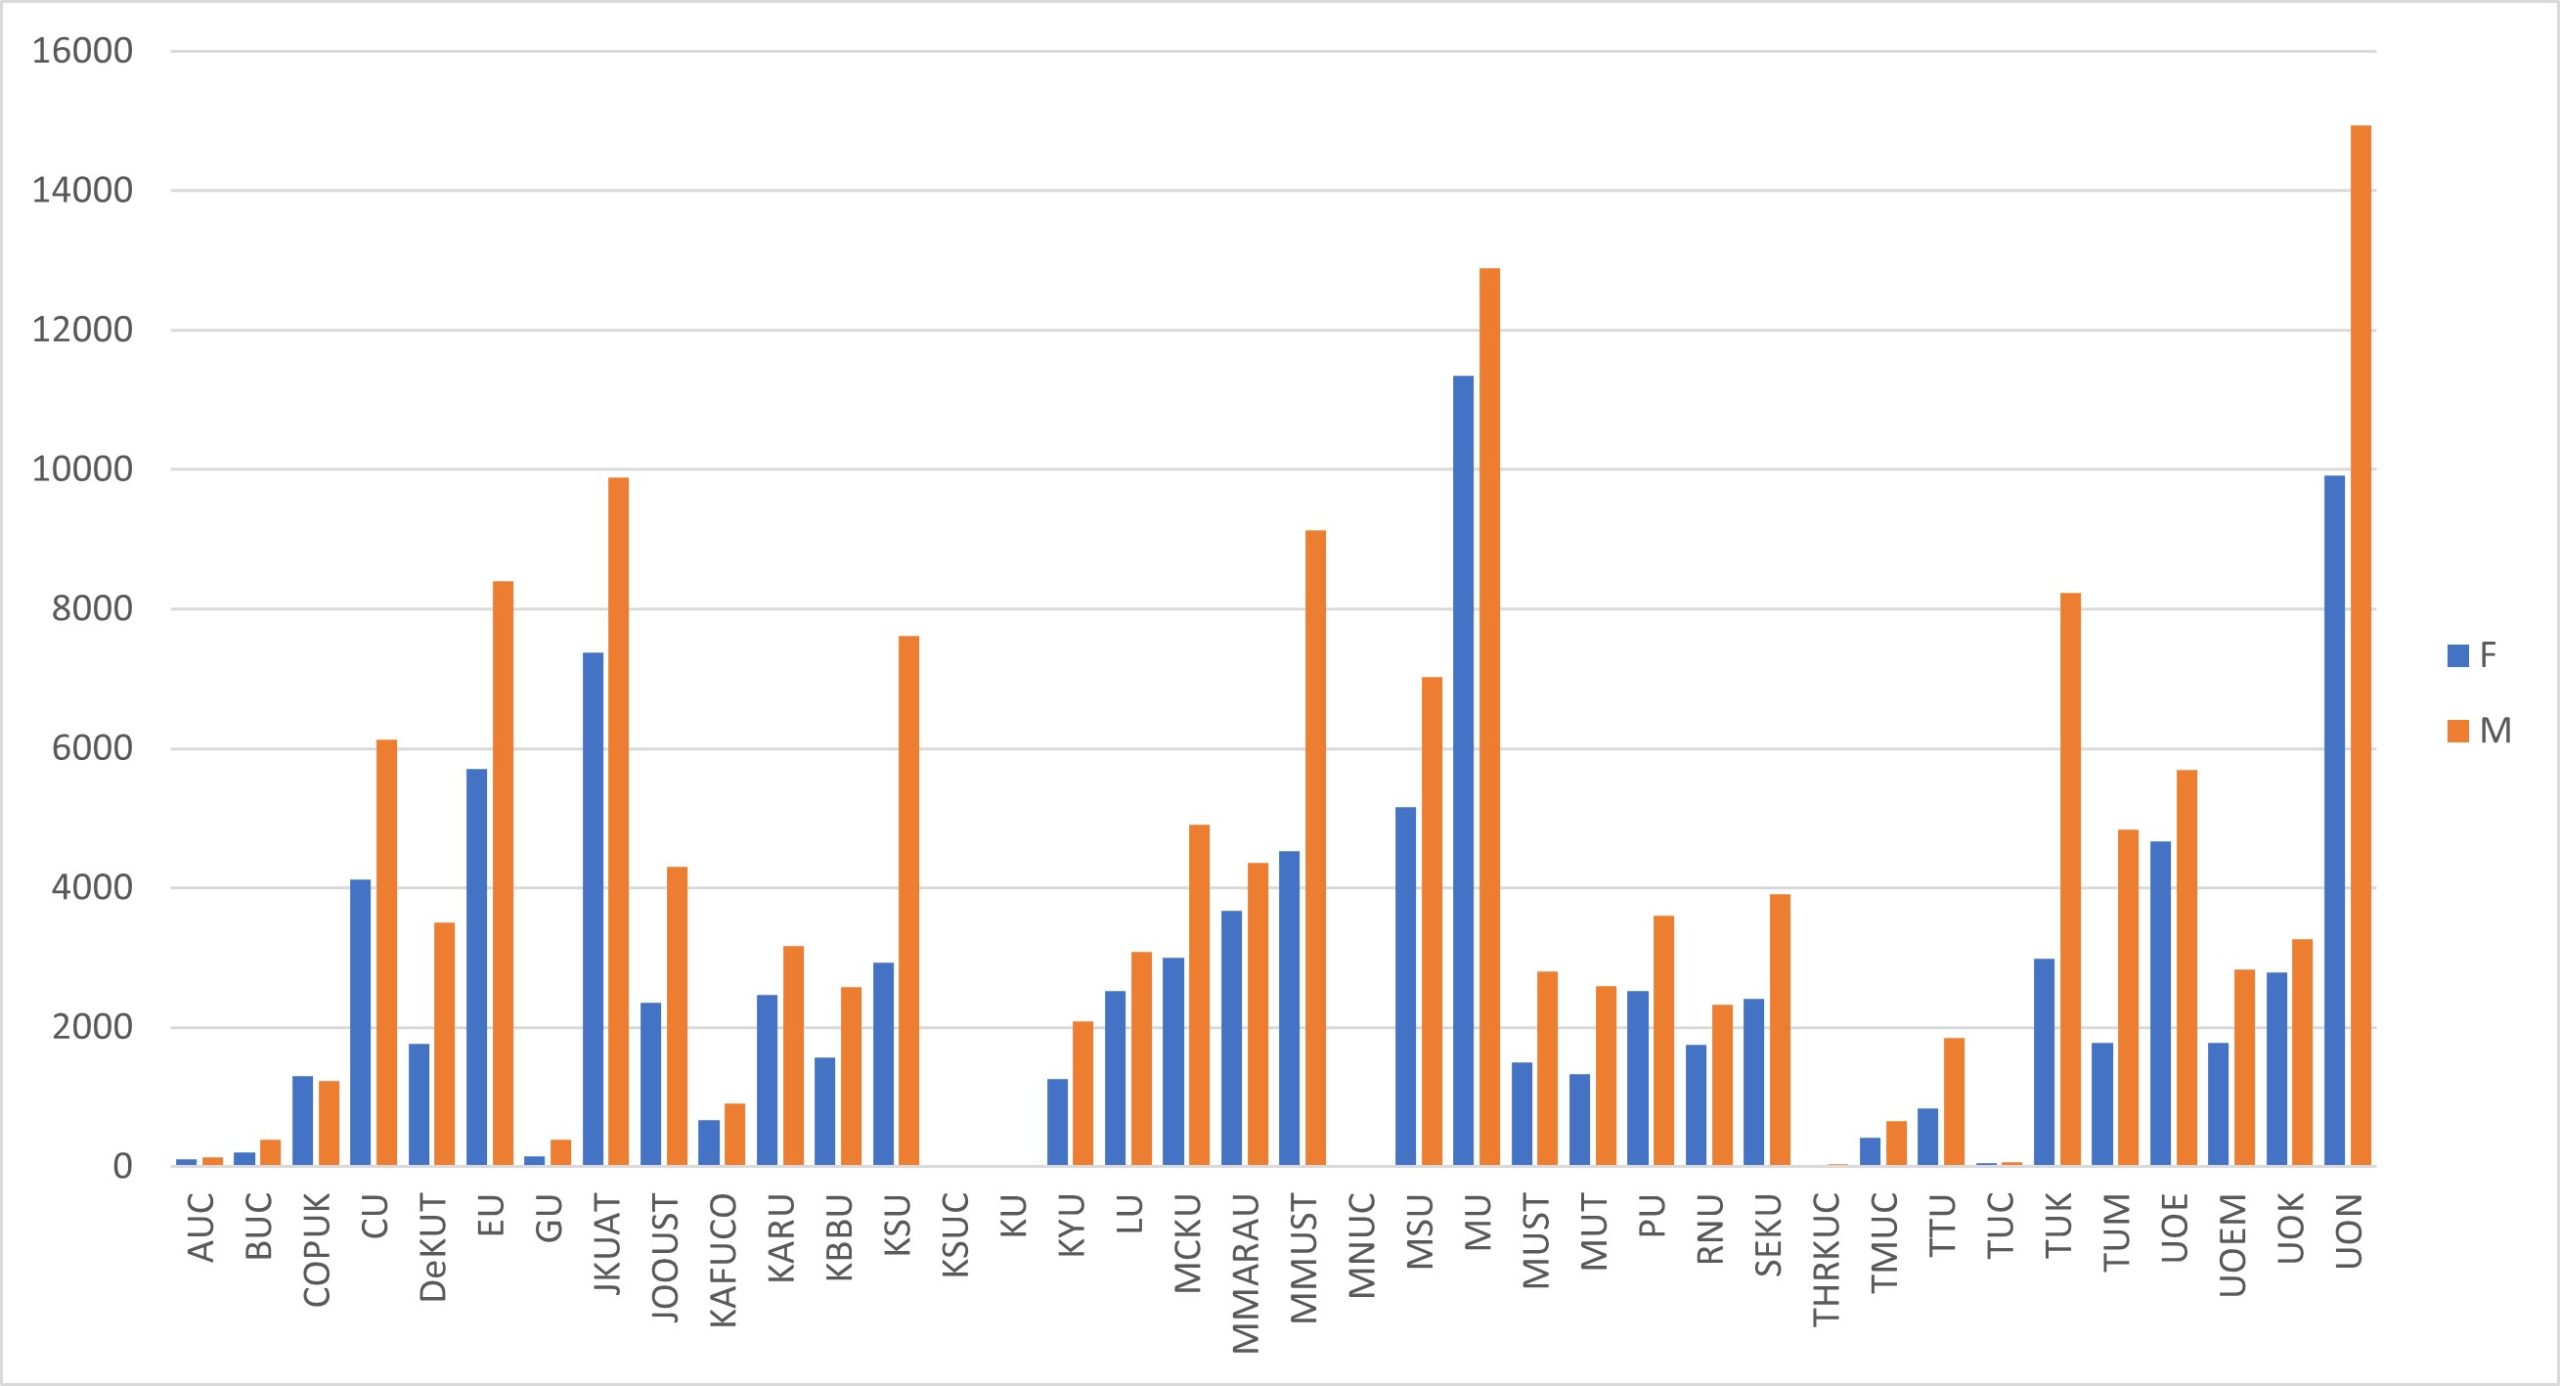
Graph 15 shows the gender distribution in all public universities in the Financial Year (FY) 2018/2019.
INSTITUTIONS | FEMALE | MALE |
Alupe University College | 107 | 139 |
Boment University College | 200 | 388 |
Chuka University | 4126 | 6128 |
Co-operative University of Kenya | 1299 | 1229 |
Dedan Kimathi University of Technology | 1766 | 3497 |
Egerton University | 5700 | 8398 |
Garissa University | 149 | 392 |
Jaramogi Oginga Odinga University of Science and Technology | 2350 | 4307 |
Jomo Kenyatta University of Agriculture and Technology | 7370 | 9887 |
Kaimosi Friends University College | 673 | 912 |
Karatina University | 2469 | 3165 |
Kibabii University | 1562 | 2570 |
Kirinyaga University | 1262 | 2081 |
Kisii University | 2927 | 7617 |
Laikipia University | 2514 | 3077 |
Maasai Mara University | 3676 | 4356 |
Machakos University | 2993 | 4910 |
Maseno University | 5158 | 7025 |
Masinde Muliro University of Science and Technology | 4531 | 9133 |
Meru University of Science and Technology | 1491 | 2802 |
Moi University | 11344 | 12892 |
Murang'a University | 1325 | 2591 |
Pwani University | 2525 | 3602 |
Rongo University | 1751 | 2331 |
South-Eastern Kenya University | 2414 | 3912 |
Taita Taveta University | 831 | 1846 |
Technical University of Kenya | 2982 | 8232 |
Technical University of Mombasa | 1776 | 4838 |
Tharaka University College | 22 | 43 |
Tom Mboya University College | 417 | 653 |
Turkana University College | 55 | 71 |
University of Eldoret | 4669 | 5698 |
University of Embu | 1776 | 2835 |
University of Kabianga | 2786 | 3264 |
University of Nairobi | 9912 | 14940 |
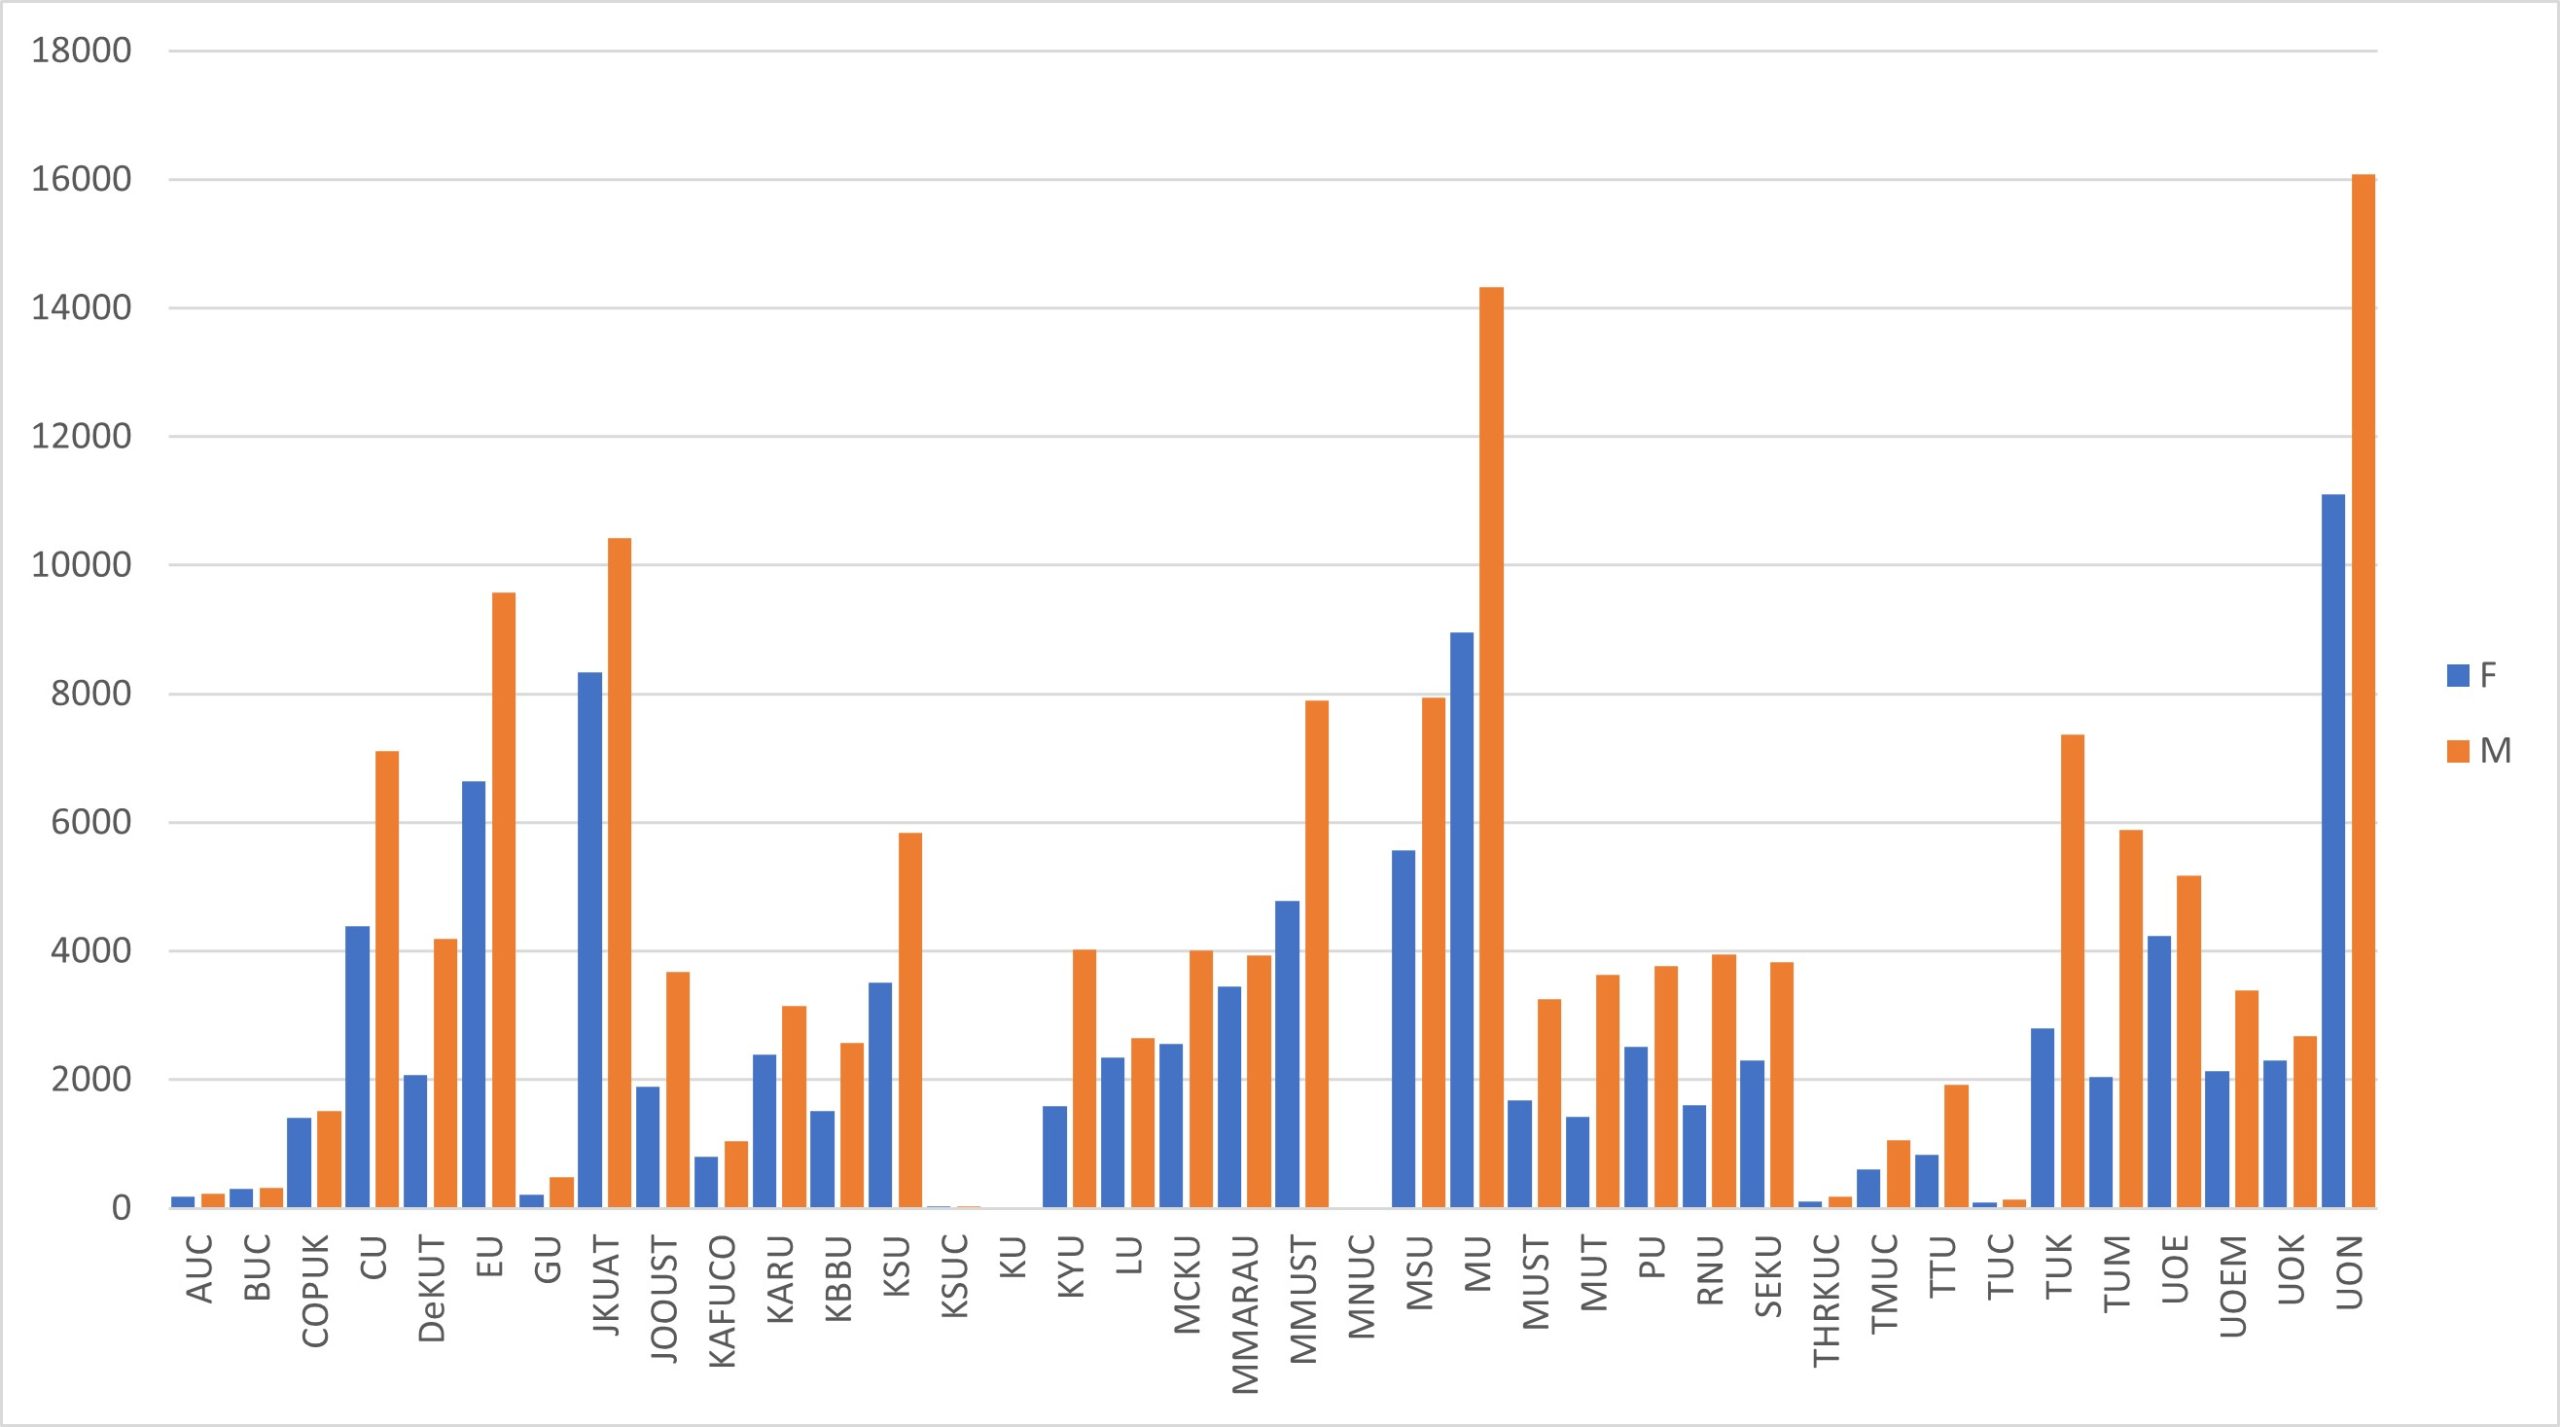
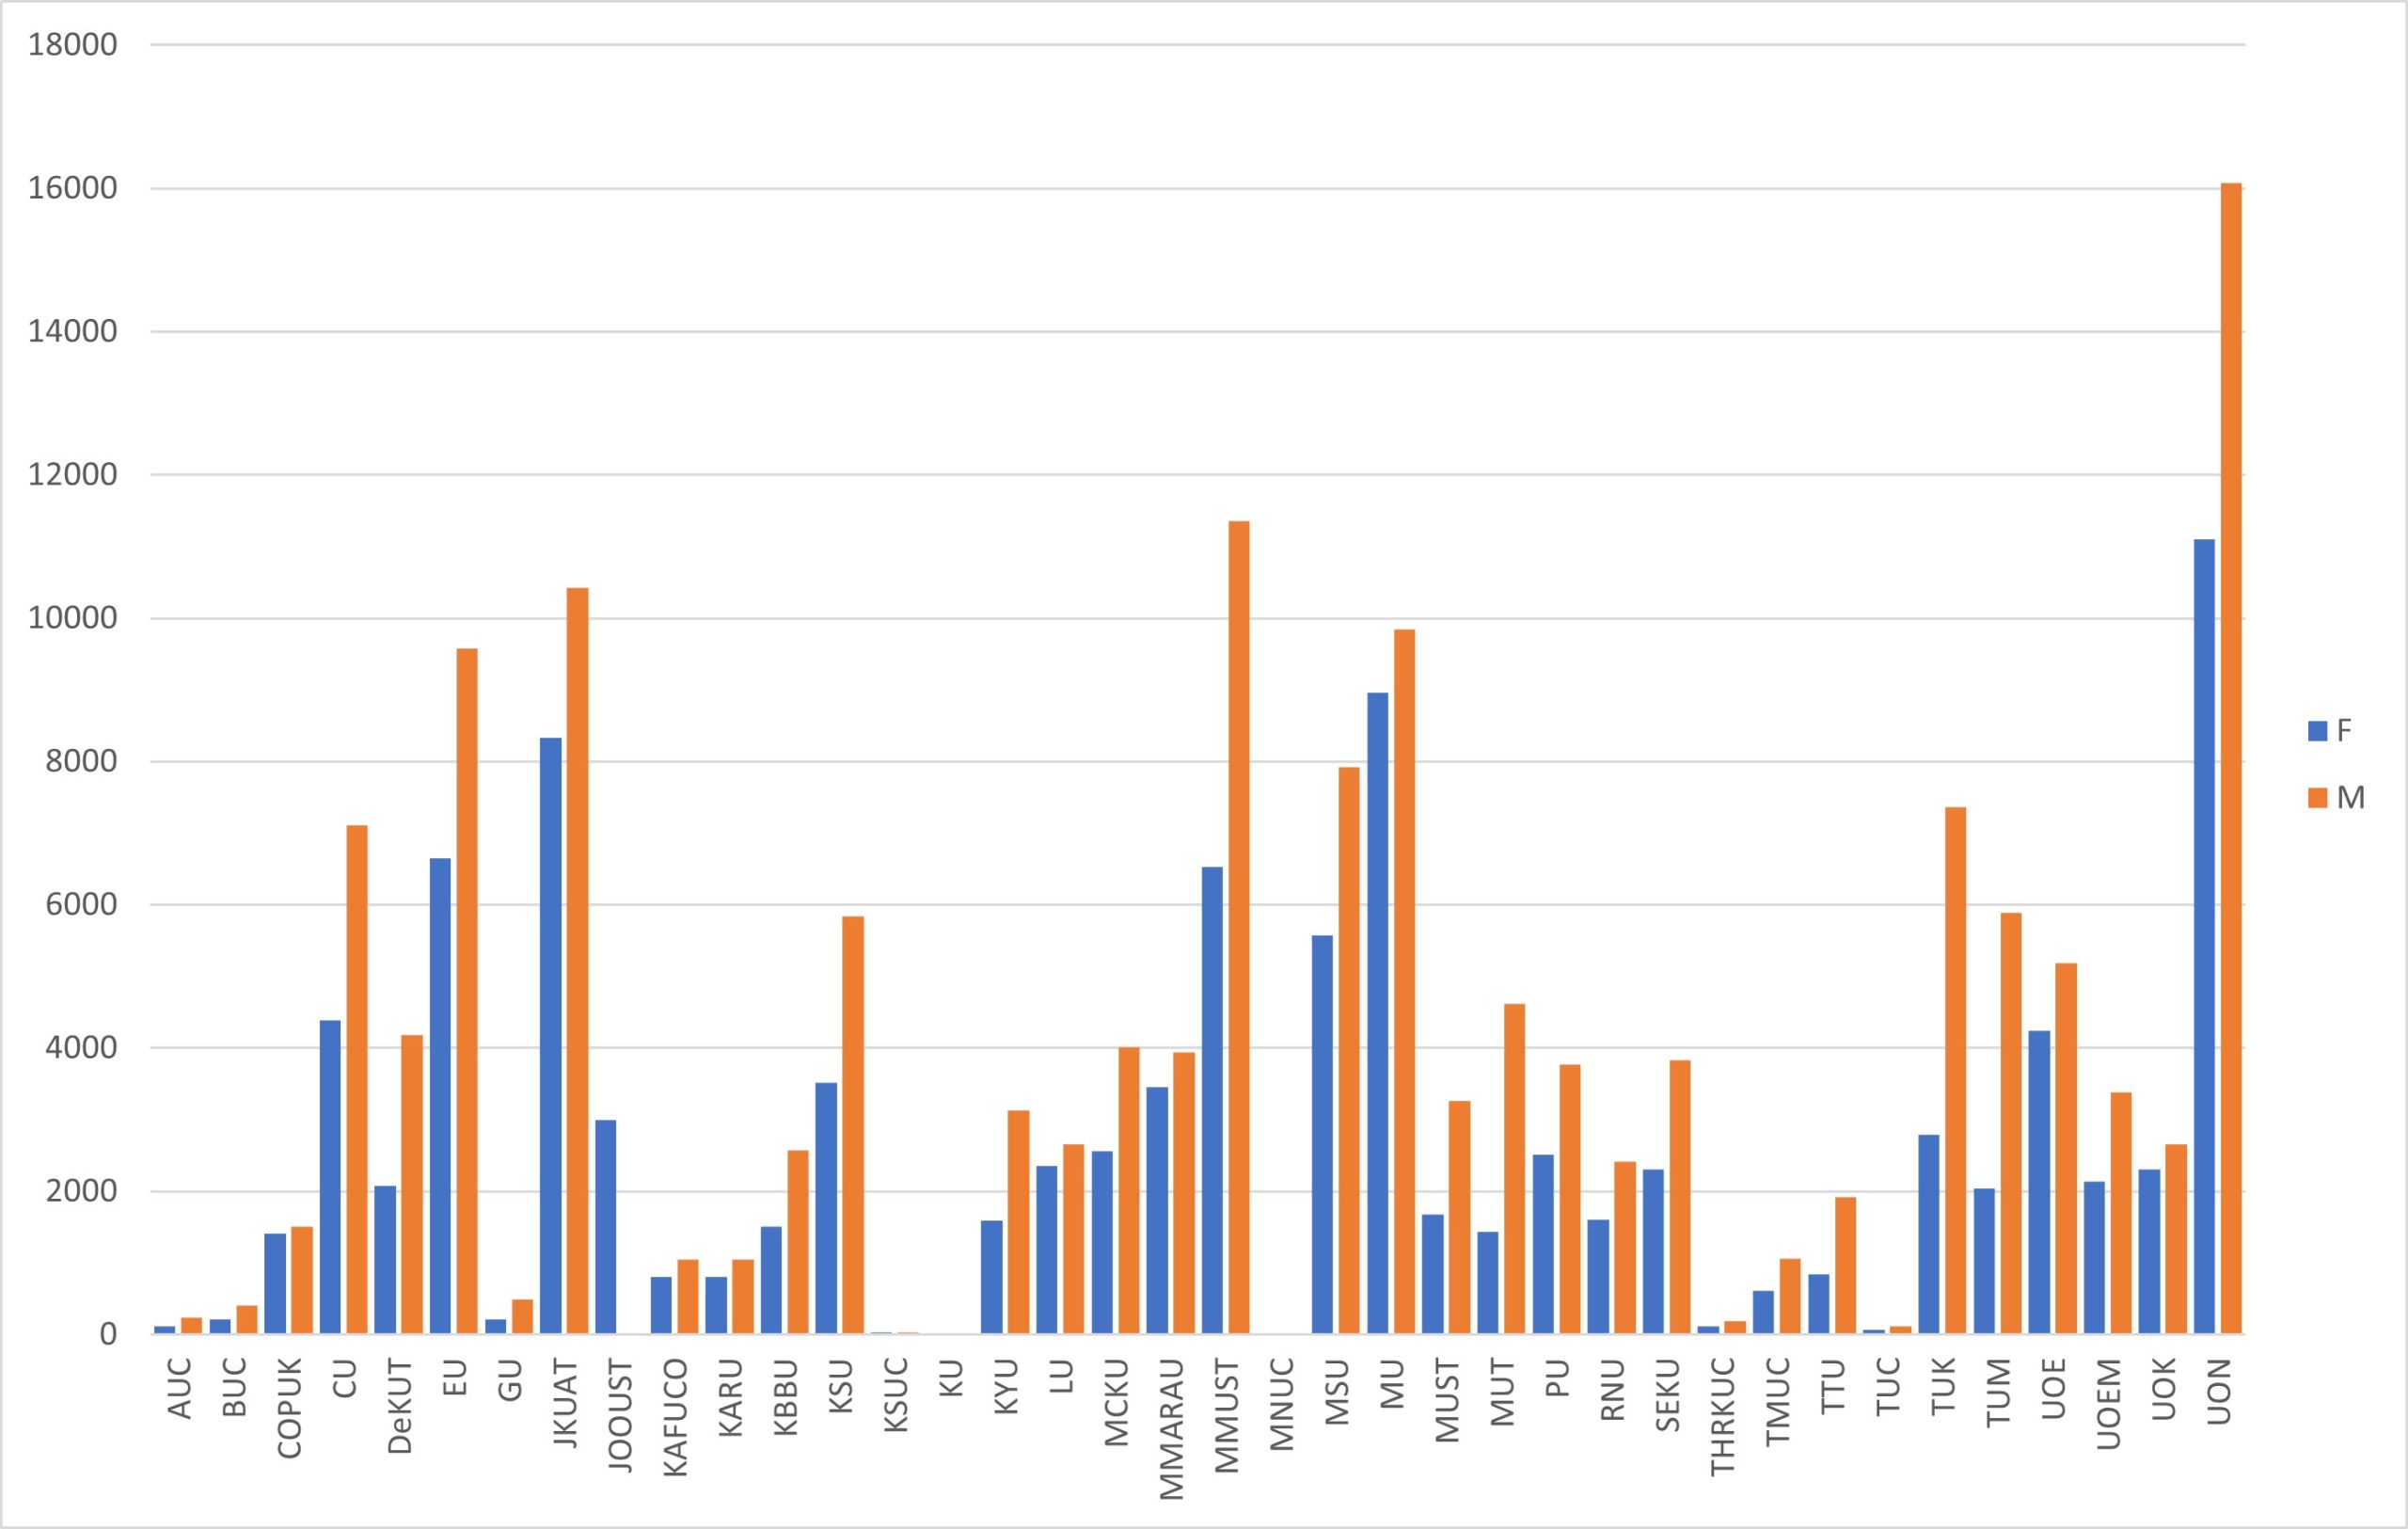
Graph 16 shows the gender distribution in all public universities in the Financial Year (FY) 2019/2020.
INSTITUTIONS | FEMALE | MALE |
Alupe University College | 177 | 234 |
Bomet University College | 300 | 322 |
Chuka University | 4387 | 7104 |
Co-operative University of Kenya | 1405 | 1511 |
Dedan Kimathi University of Technology | 2075 | 4187 |
Egerton University | 6642 | 9572 |
Garissa University | 216 | 491 |
Jaramogi Oginga Odinga University of Science and Technology | 1895 | 3681 |
Jomo Kenyatta University of Agriculture and Technology | 8334 | 10424 |
Kaimosi Friends University College | 809 | 1052 |
Karatina University | 2398 | 3150 |
Kibabii University | 1509 | 2576 |
Kirinyaga University | 1593 | 4021 |
Kisii University | 3508 | 5837 |
Koitalel Samoei University College | 28 | 34 |
Laikipia University | 2349 | 2655 |
Maasai Mara University | 3457 | 3934 |
Machakos University | 2564 | 4016 |
Maseno University | 5570 | 7943 |
Masinde Muliro University of Science and Technology | 4779 | 7895 |
Meru University of Science and Technology | 1674 | 3259 |
Moi University | 8957 | 14323 |
Murang'a University | 1430 | 3633 |
Pwani University | 2509 | 3764 |
Rongo University | 1602 | 3952 |
South Eastern Kenya University | 2307 | 3831 |
Taita Taveta University | 837 | 1922 |
Technical University of Kenya | 2792 | 7361 |
Technical University of Mombasa | 2041 | 5888 |
Tharaka University College | 112 | 189 |
Tom Mboya University College | 607 | 1057 |
Turkana University College | 93 | 137 |
University of Eldoret | 4242 | 5180 |
University of Embu | 2138 | 3385 |
University of Kabianga | 2299 | 2672 |
University of Nairobi | 11105 | 16077 |
Graph 17 shows the gender distribution in all public universities in the Financial Year (FY) 2021/2022.
INSTITUTIONS | FEMALE | MALE |
Alupe University College | 117 | 235 |
Bomet University College | 216 | 402 |
Chuka University | 4387 | 7104 |
Co-operative University of Kenya | 1406 | 1511 |
Dedan Kimathi University of Technology | 2075 | 4182 |
Egerton University | 6643 | 9572 |
Garissa University | 217 | 487 |
Jaramogi Oginga Odinga University of Science and Technology | 2996 | 4129 |
Jomo Kenyatta University of Agriculture and Technology | 8334 | 10425 |
Kaimosi Friends University College | 809 | 1052 |
Karatina University | 810 | 1052 |
Kibabii University | 1509 | 2577 |
Kirinyaga University | 1593 | 3124 |
Kisii University | 3510 | 5837 |
Koitalel Samoei University College | 28 | 25 |
Laikipia University | 2350 | 2655 |
Maasai Mara University | 3457 | 3934 |
Machakos University | 2565 | 4016 |
Maseno University | 5571 | 7925 |
Masinde Muliro University of Science and Technology | 4779 | 7892 |
Meru University of Science and Technology | 1675 | 3259 |
Moi University | 8958 | 9840 |
Murang'a University | 1754 | 3469 |
Pwani University | 1431 | 4622 |
Rongo University | 2510 | 3764 |
South Eastern Kenya University | 1603 | 2410 |
Taita Taveta University | 2308 | 3831 |
Technical University of Kenya | 838 | 1921 |
Technical University of Mombasa | 2793 | 7361 |
Tharaka University College | 2041 | 5889 |
Tom Mboya University College | 112 | 190 |
Turkana University College | 608 | 1058 |
University of Eldoret | 61 | 110 |
University of Embu | 4243 | 5180 |
University of Kabianga | 2139 | 3386 |
UON | 11105 | 16076 |
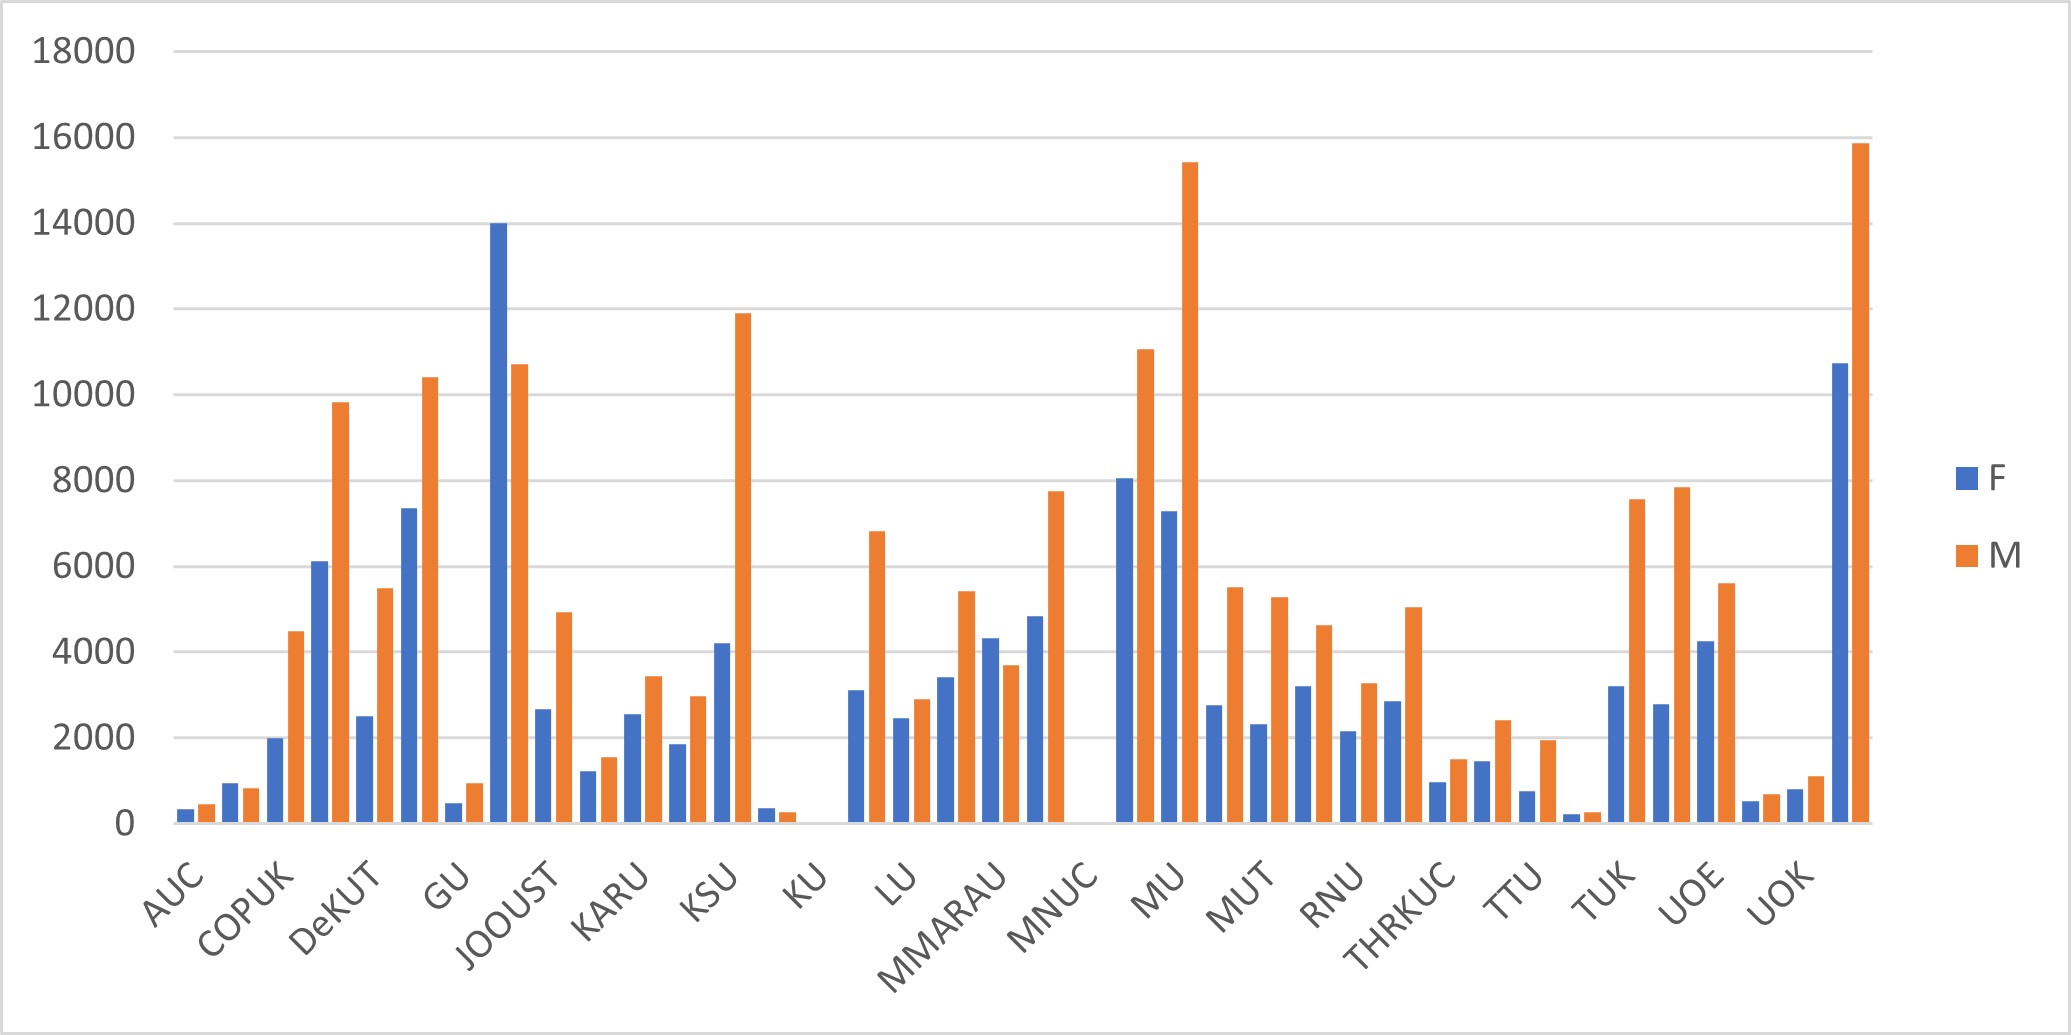
Graph 18 shows the gender distribution in all public universities in the Financial Year (FY) 2022/2023.
INSTITUTIONS | FEMALE | MALE |
Alupe University College | 334 | 451 |
Bomet University College | 953 | 825 |
Chuka University | 6116 | 9821 |
Co-operative University of Kenya | 2001 | 4495 |
Dedan Kimathi University of Technology | 2503 | 5497 |
Egerton University | 7351 | 10409 |
Garissa University | 473 | 954 |
Jaramogi Oginga Odinga University of Science and Technology | 2679 | 4921 |
Jomo Kenyatta University of Agriculture and Technology | 13996 | 10717 |
Kaimosi Friends University College | 1218 | 1555 |
Karatina University | 2564 | 3439 |
Kibabii University | 1865 | 2975 |
Kirinyaga University | 3114 | 6822 |
Kisii University | 4218 | 11908 |
Koitalel Samoei University College | 357 | 266 |
Laikipia University | 2454 | 2899 |
Maasai Mara University | 4327 | 3691 |
Machakos University | 3426 | 5432 |
Maseno University | 8060 | 11070 |
Masinde Muliro University of Science and Technology | 4844 | 7744 |
Meru University of Science and Technology | 2769 | 5511 |
Moi University | 7276 | 15428 |
Murang'a University | 2328 | 5289 |
Pwani University | 3213 | 4639 |
Rongo University | 2163 | 3282 |
South Eastern Kenya University | 2855 | 5043 |
Taita Taveta University | 768 | 1957 |
Technical University of Kenya | 3218 | 7571 |
Technical University of Mombasa | 2783 | 7857 |
Tharaka University College | 977 | 1510 |
Tom Mboya University College | 1448 | 2407 |
Turkana University College | 222 | 263 |
University of Eldoret | 4263 | 5619 |
University of Embu | 522 | 682 |
University of Kabianga | 799 | 1114 |
University of Nairobi | 10743 | 15873 |
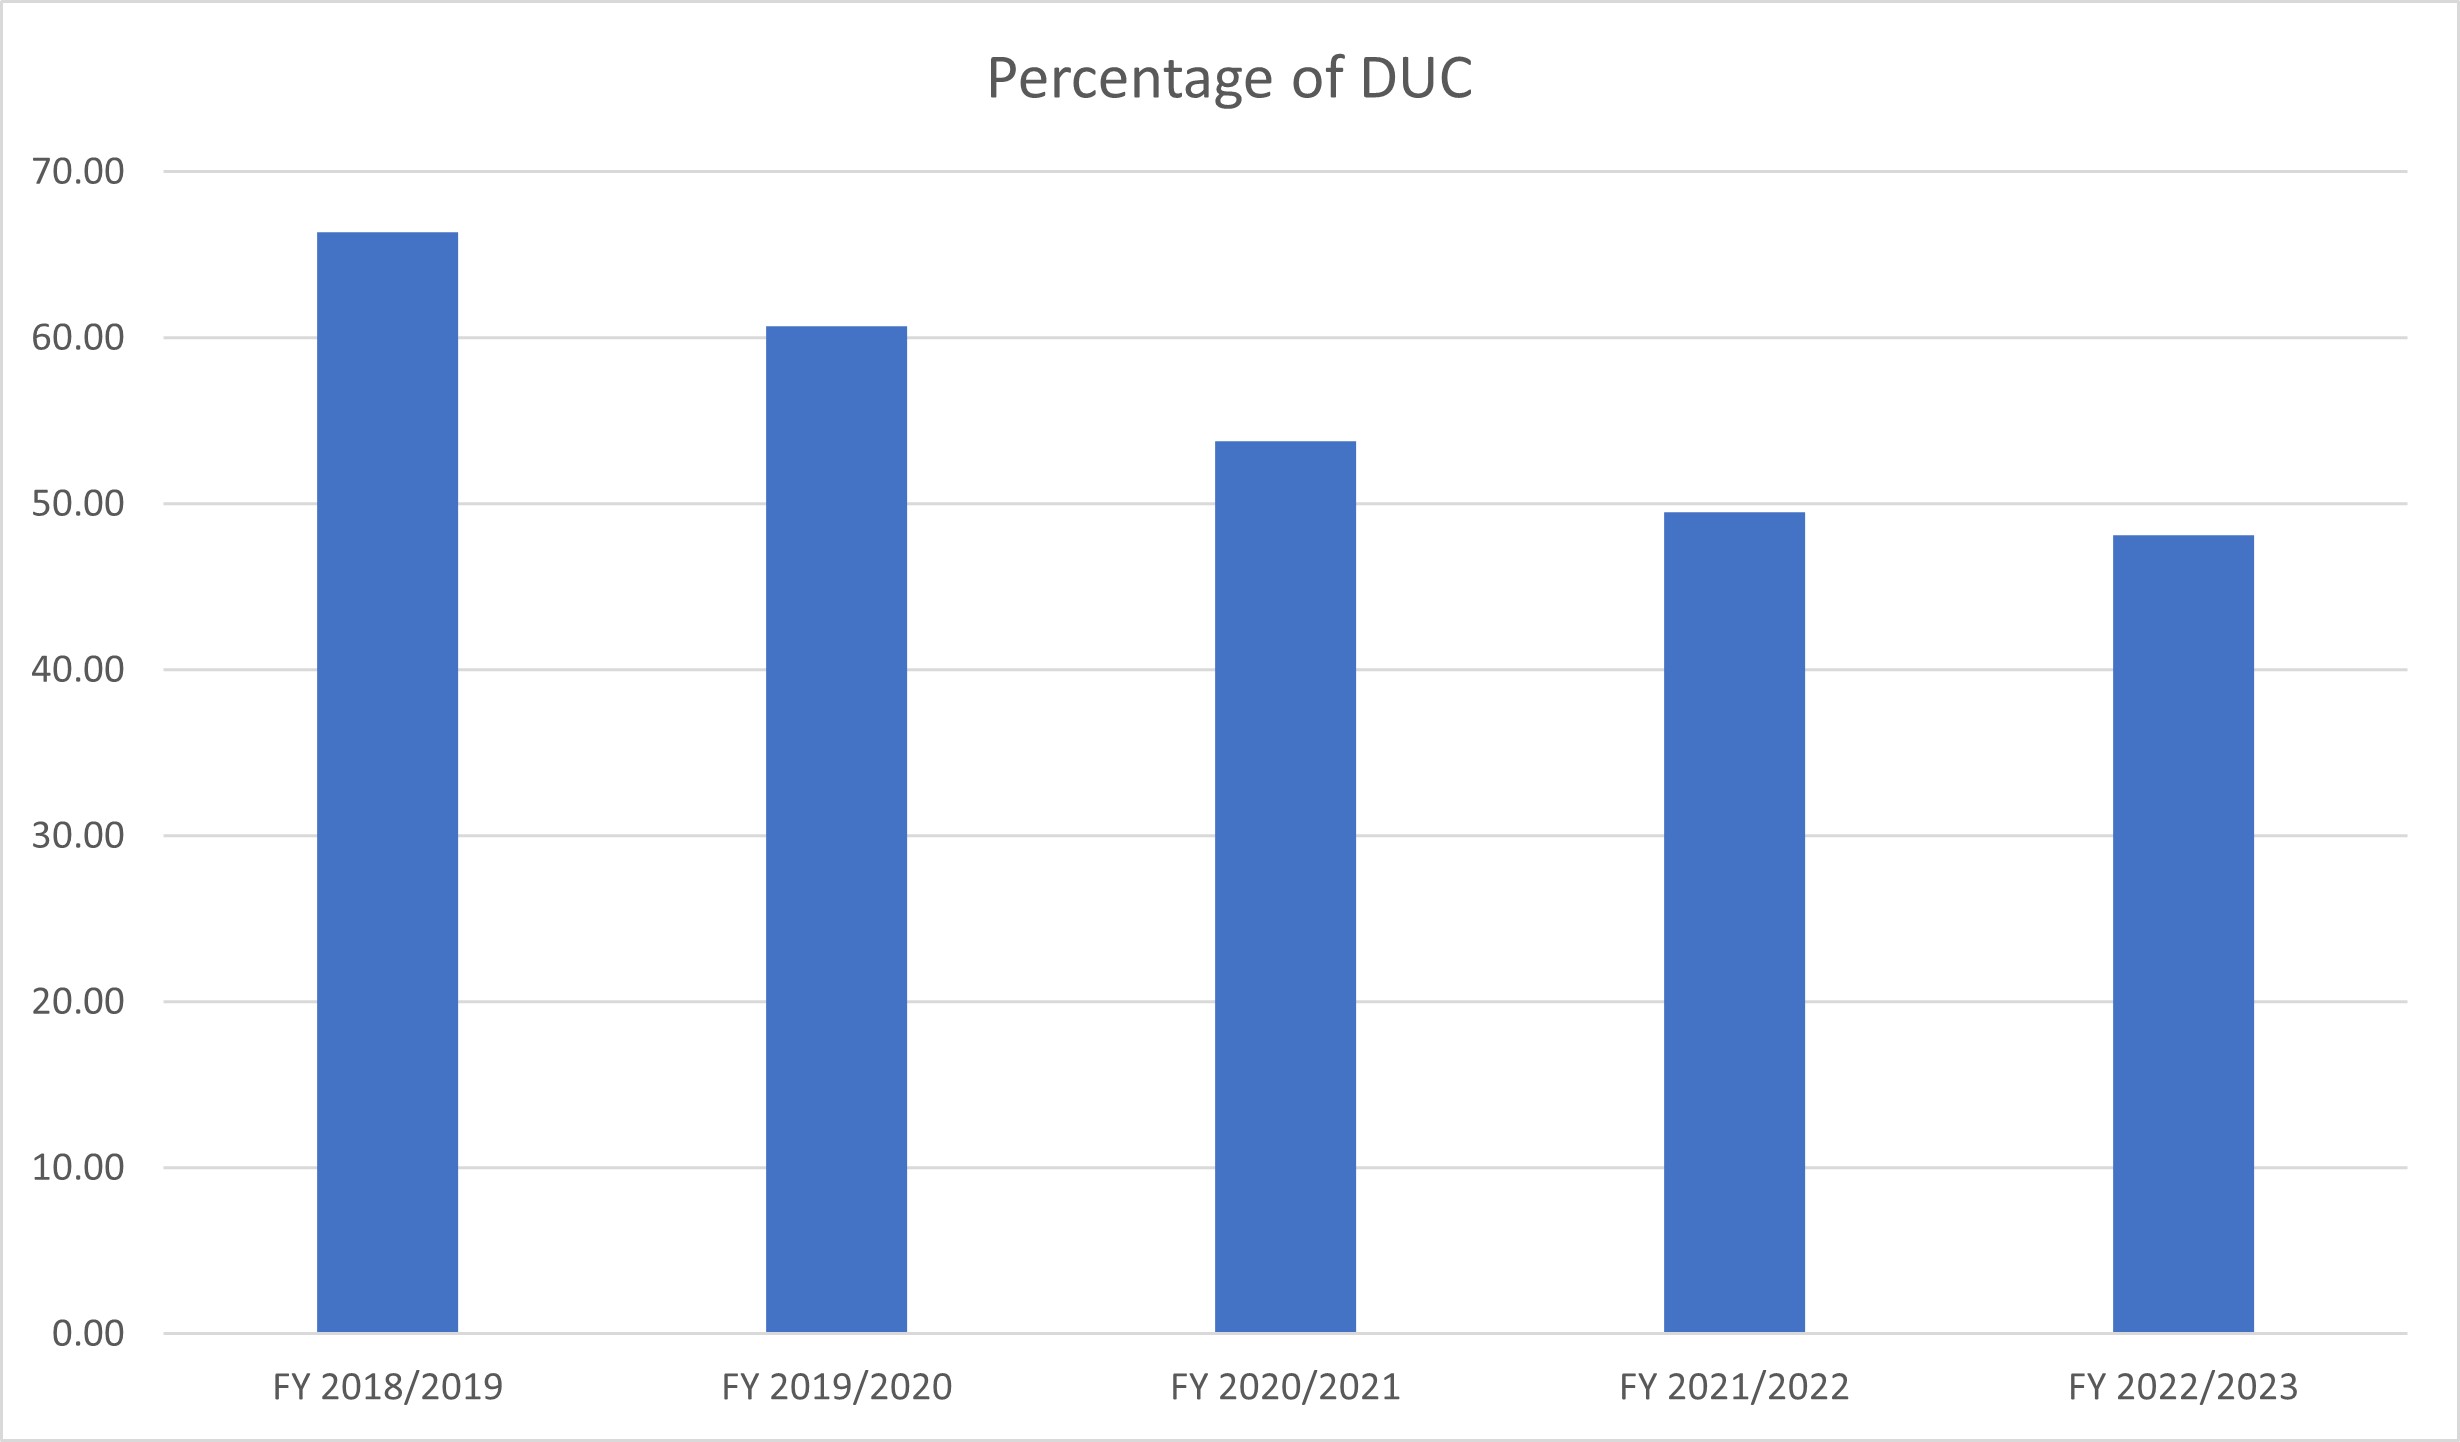
The Government of Kenya (GoK) through the UF uses the Differentiated Unit Cost (DUC) criterion to apportion funds to universities in Kenya. The criterion promotes equity, equality and fairness in distribution of funds. The GoK is mandated to support universities to a tune of 80% of the unit cost. However, due to lack of sufficient funds, the allocation has been at 60% and gradually going lower to about 48% in 2022.
Graph 19 shows the percentage of DUC allocated to all public universities since the Financial Year (FY) 2018/2019 to FY 2022/2023.
S/NO | FINANCIAL YEAR | % DUC |
1 | FY 2018/2019 | 66.40 |
2 | FY 2019/2020 | 60.70 |
3 | FY 2020/2021 | 53.77 |
4 | FY 2021/2022 | 49.51 |
5 | FY 2022/2023 | 48.11 |
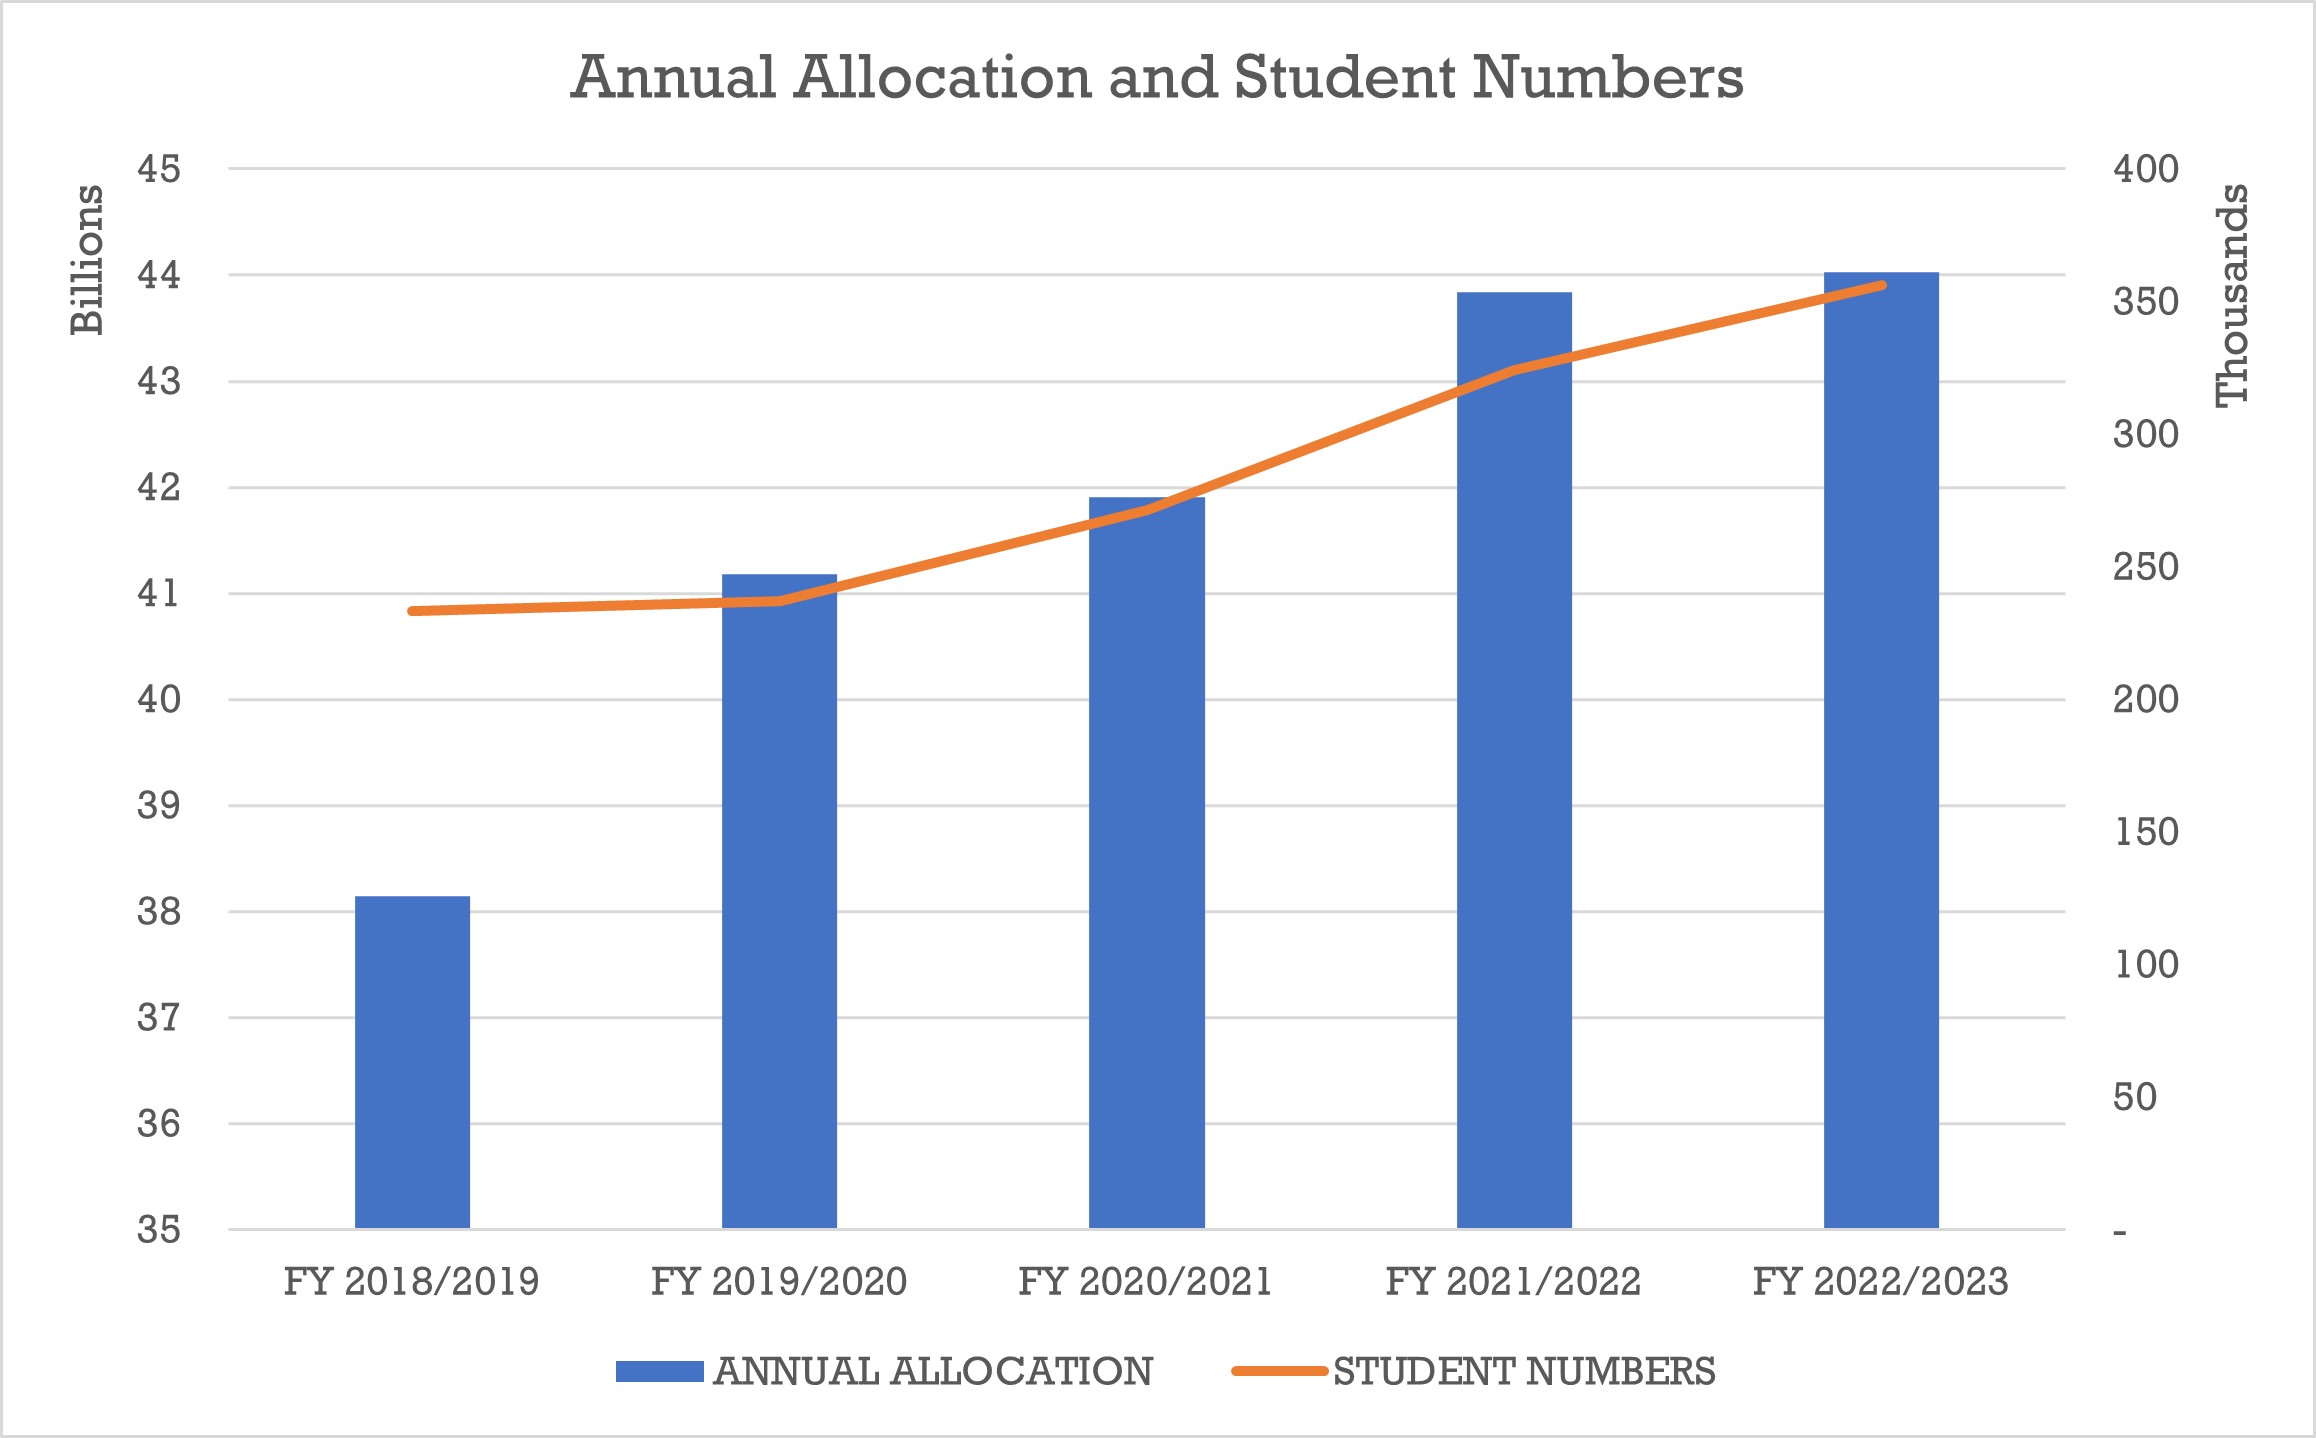
Graph 20 shows the total amount allocated to all public universities since the Financial Year (FY) 2018/2019 to FY 2022/2023. The amount ranges from 38 billion in FY 2018/2019 to 44 billion in FY 2022/2023 and is represented using the bar graph.
The line graph shows the number of students in all public universities since the Financial Year (FY) 2018/2019 to FY 2022/2023.
S/NO | FINANCIAL YEAR | STUDENT NUMBERS |
1 | FY 2018/2019 | 233,218 |
2 | FY 2019/2020 | 237,011 |
3 | FY 2020/2021 | 271,446 |
4 | FY 2021/2022 | 324,182 |
5 | FY 2022/2023 | 356,188 |
S/NO | FINANCIAL YEAR | ANNUAL ALLOCATION |
1 | FY 2018/2019 | 38,145,164,999.49 |
2 | FY 2019/2020 | 41,180,214,789.00 |
3 | FY 2020/2021 | 41,907,420,216.50 |
4 | FY 2021/2022 | 43,843,955,004.00 |
5 | FY 2022/2023 | 44,023,955,000.00 |
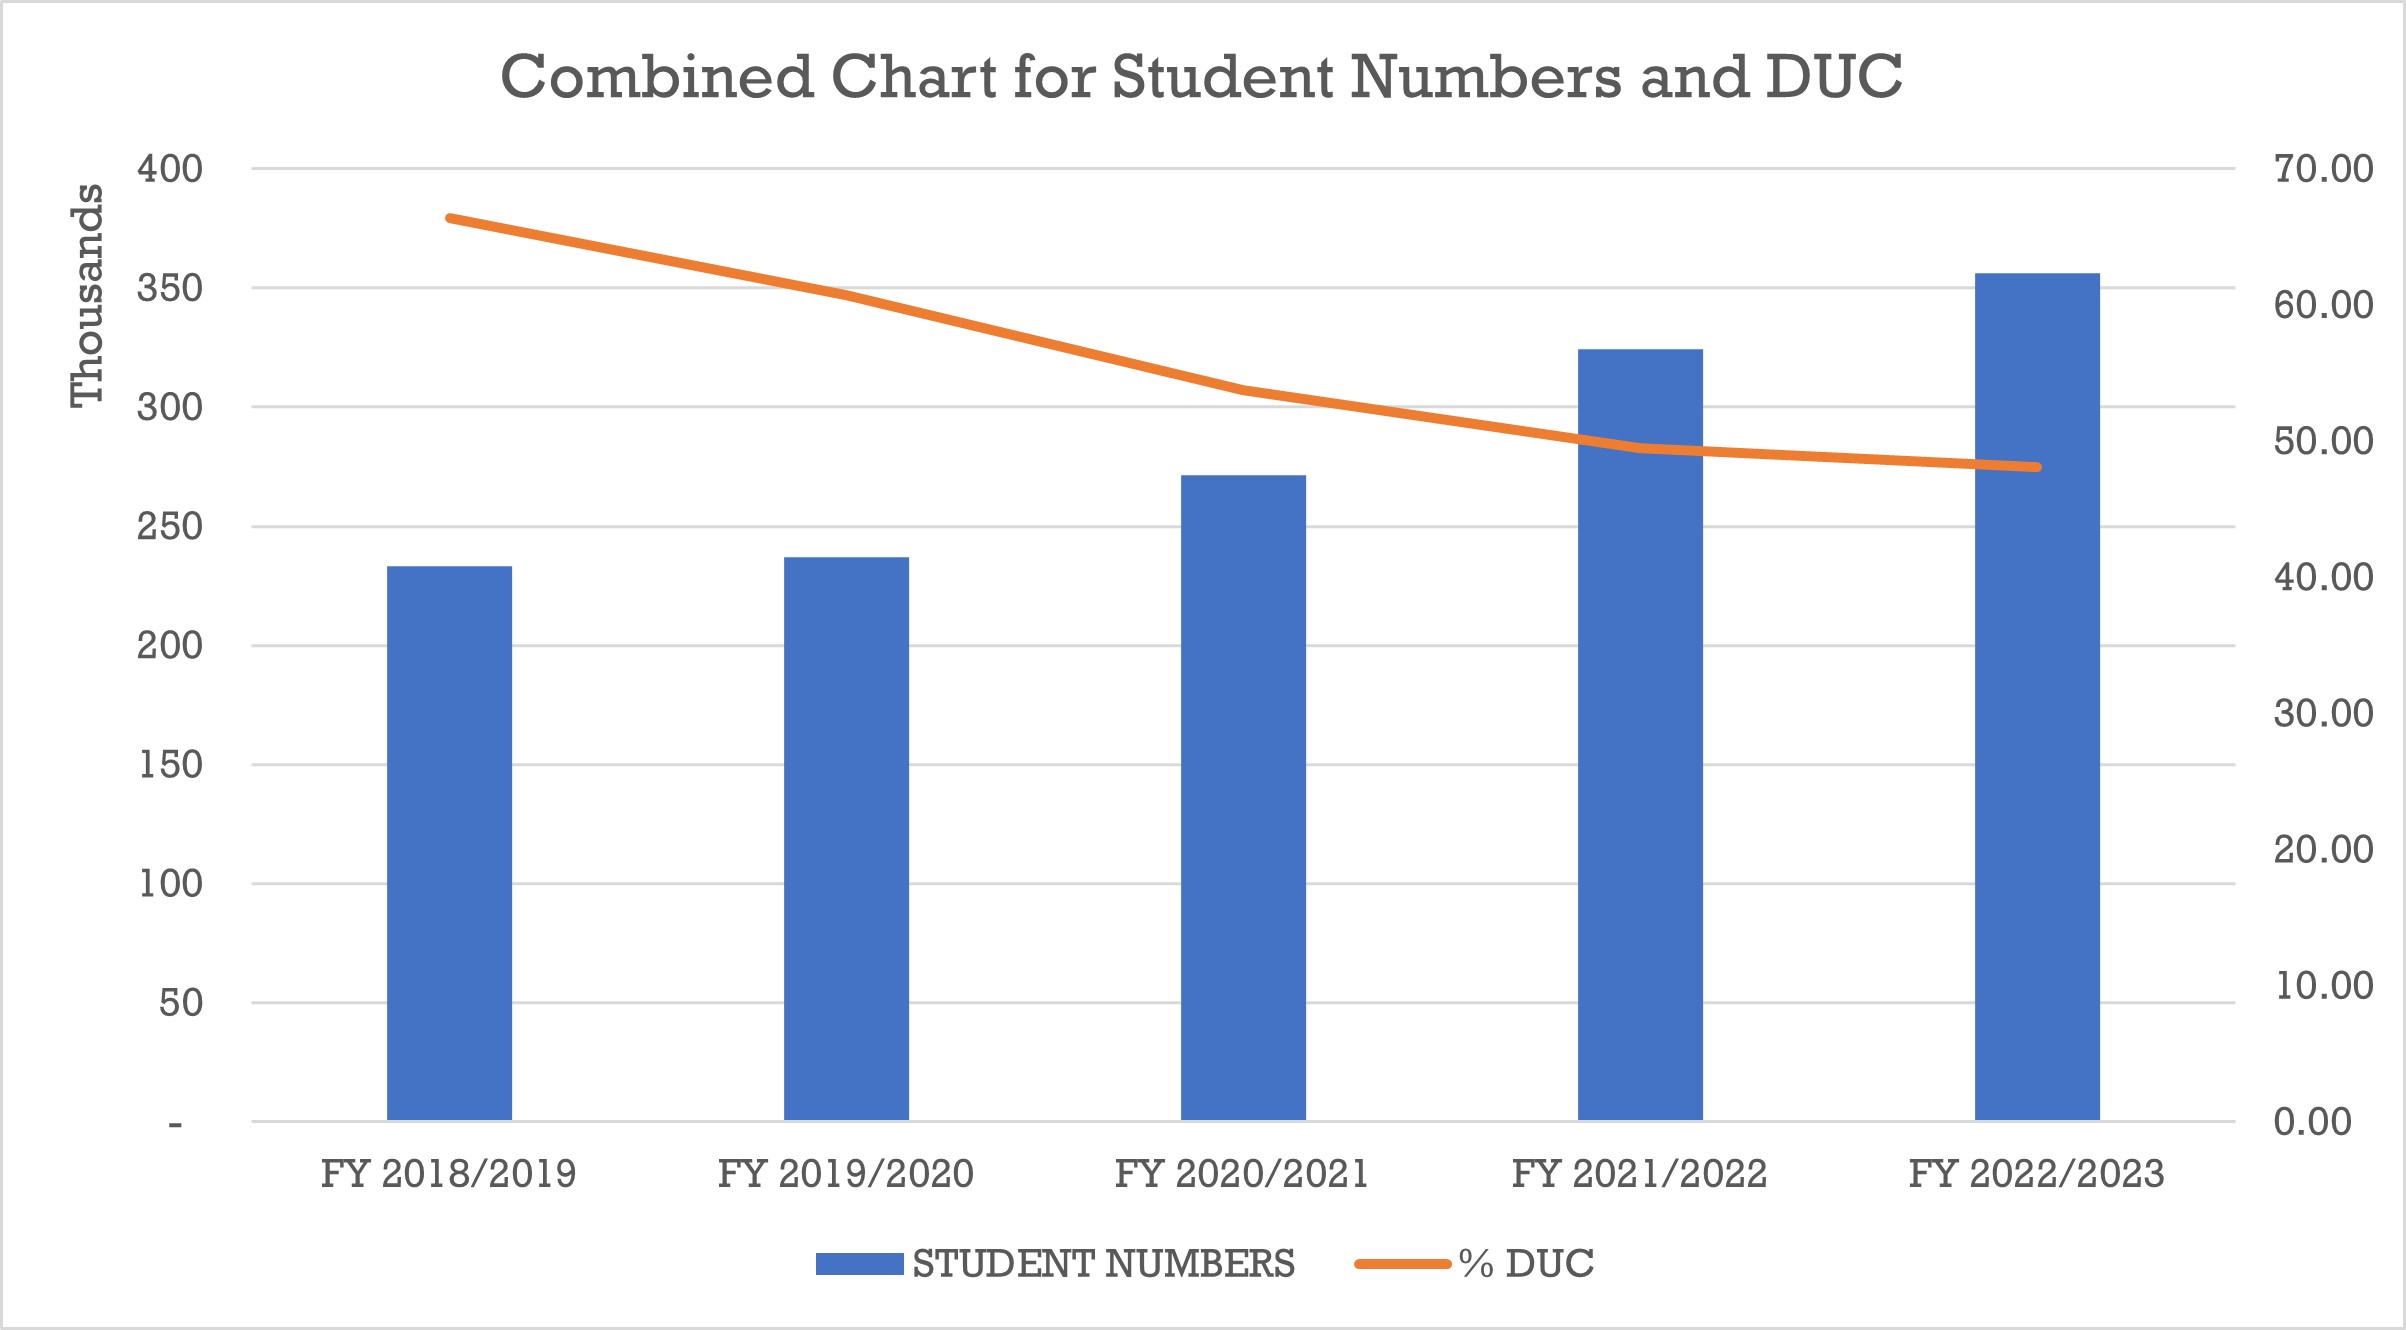
Graph 21 shows how the relationship between the student numbers over the years and the DUC percentage. It is worth noting that as student numbers increased, the DUC funding reduced.
S/NO | FINANCIAL YEAR | STUDENT NUMBERS |
1 | FY 2018/2019 | 233,218 |
2 | FY 2019/2020 | 237,011 |
3 | FY 2020/2021 | 271,446 |
4 | FY 2021/2022 | 324,182 |
5 | FY 2022/2023 | 356,188 |
S/NO | FINANCIAL YEAR | % DUC |
1 | FY 2018/2019 | 66.40 |
2 | FY 2019/2020 | 60.70 |
3 | FY 2020/2021 | 53.77 |
4 | FY 2021/2022 | 49.51 |
5 | FY 2022/2023 | 48.11 |
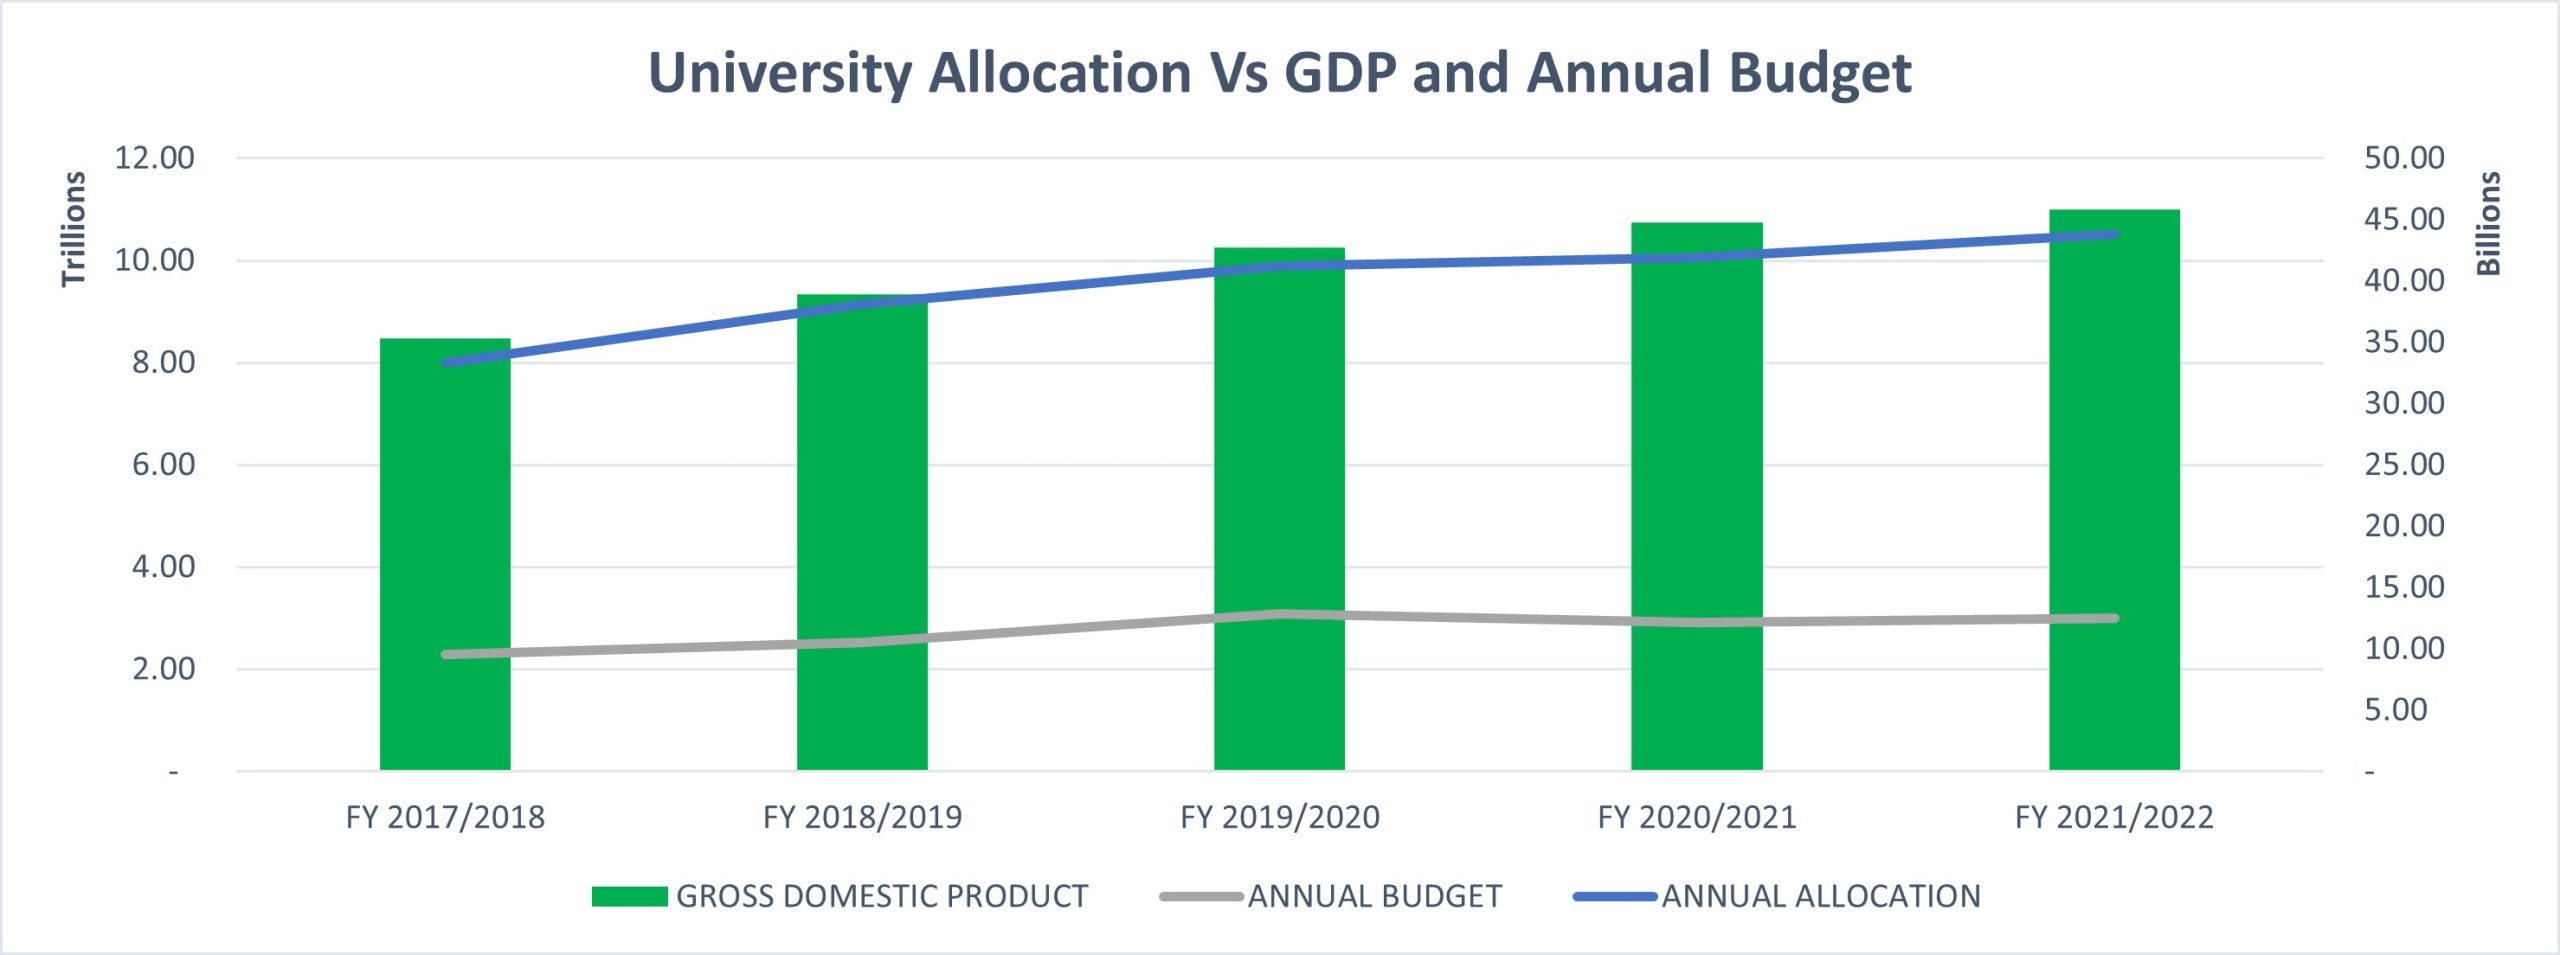
Graph 22 shows how the annual allocations to universities compare in relation to the country’s Gross Domestic Product (GDP) and annual national budget. The GDP and Annual budget are read from the vertical axis on the left and the Annual Allocation is read from the vertical axis on the right.
FINANCIAL YEAR | ANNUAL ALLOCATION | GROSS DOMESTIC PRODUCT | ANNUAL BUDGET |
FY 2017/2018 | 33,313,405,680.49 | 8,483,396,000,000 | 2,290,000,000,000 |
FY 2018/2019 | 38,145,164,999.49 | 9,340,307,000,000 | 2,530,000,000,000 |
FY 2019/2020 | 41,180,214,789.00 | 10,255,654,000,000 | 3,080,000,000,000 |
FY 2020/2021 | 41,907,420,216.50 | 10,752,992,000,000 | 2,910,000,000,000 |
FY 2021/2022 | 43,843,955,004.00 | 11,000,000,000,000 | 3,000,000,000,000 |
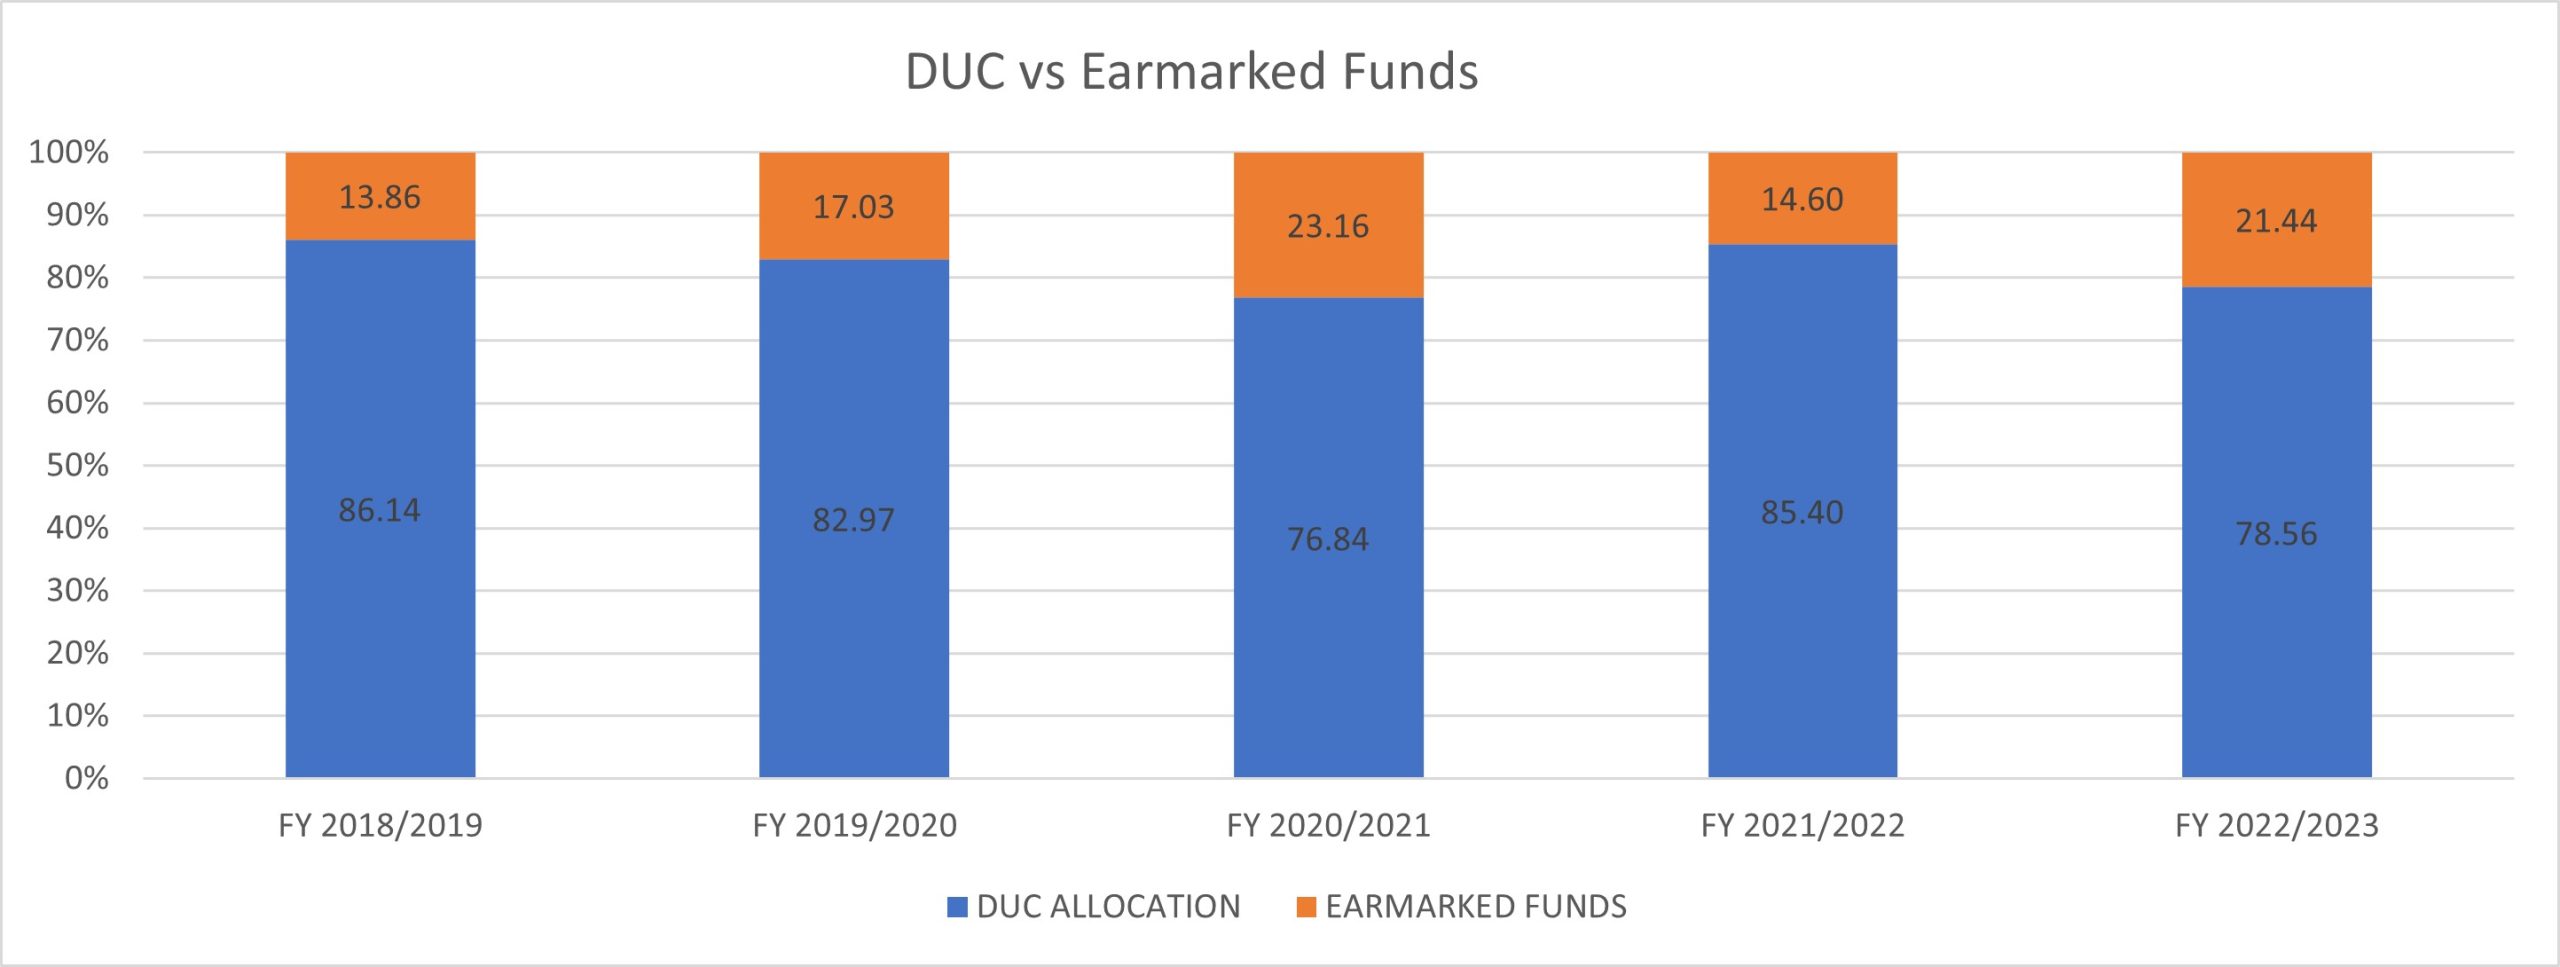
Graph 23 shows how the funds were allocated in different financial years from 2018/2019 to 2022/2021. The DUC Allocation was allocated using the DUC criterion and the Earmarked Funds include the CBA Allocations, Doctor’s allowances and constituent colleges intervention.
S/NO | FINANCIAL YEAR | DUC ALLOCATION | EARMARKED FUNDS |
1 | FY 2018/2019 | 86.14 | 13.86 |
2 | FY 2019/2020 | 82.97 | 17.03 |
3 | FY 2020/2021 | 76.84 | 23.16 |
4 | FY 2021/2022 | 85.40 | 14.60 |
5 | FY 2022/2023 | 78.56 | 21.44 |
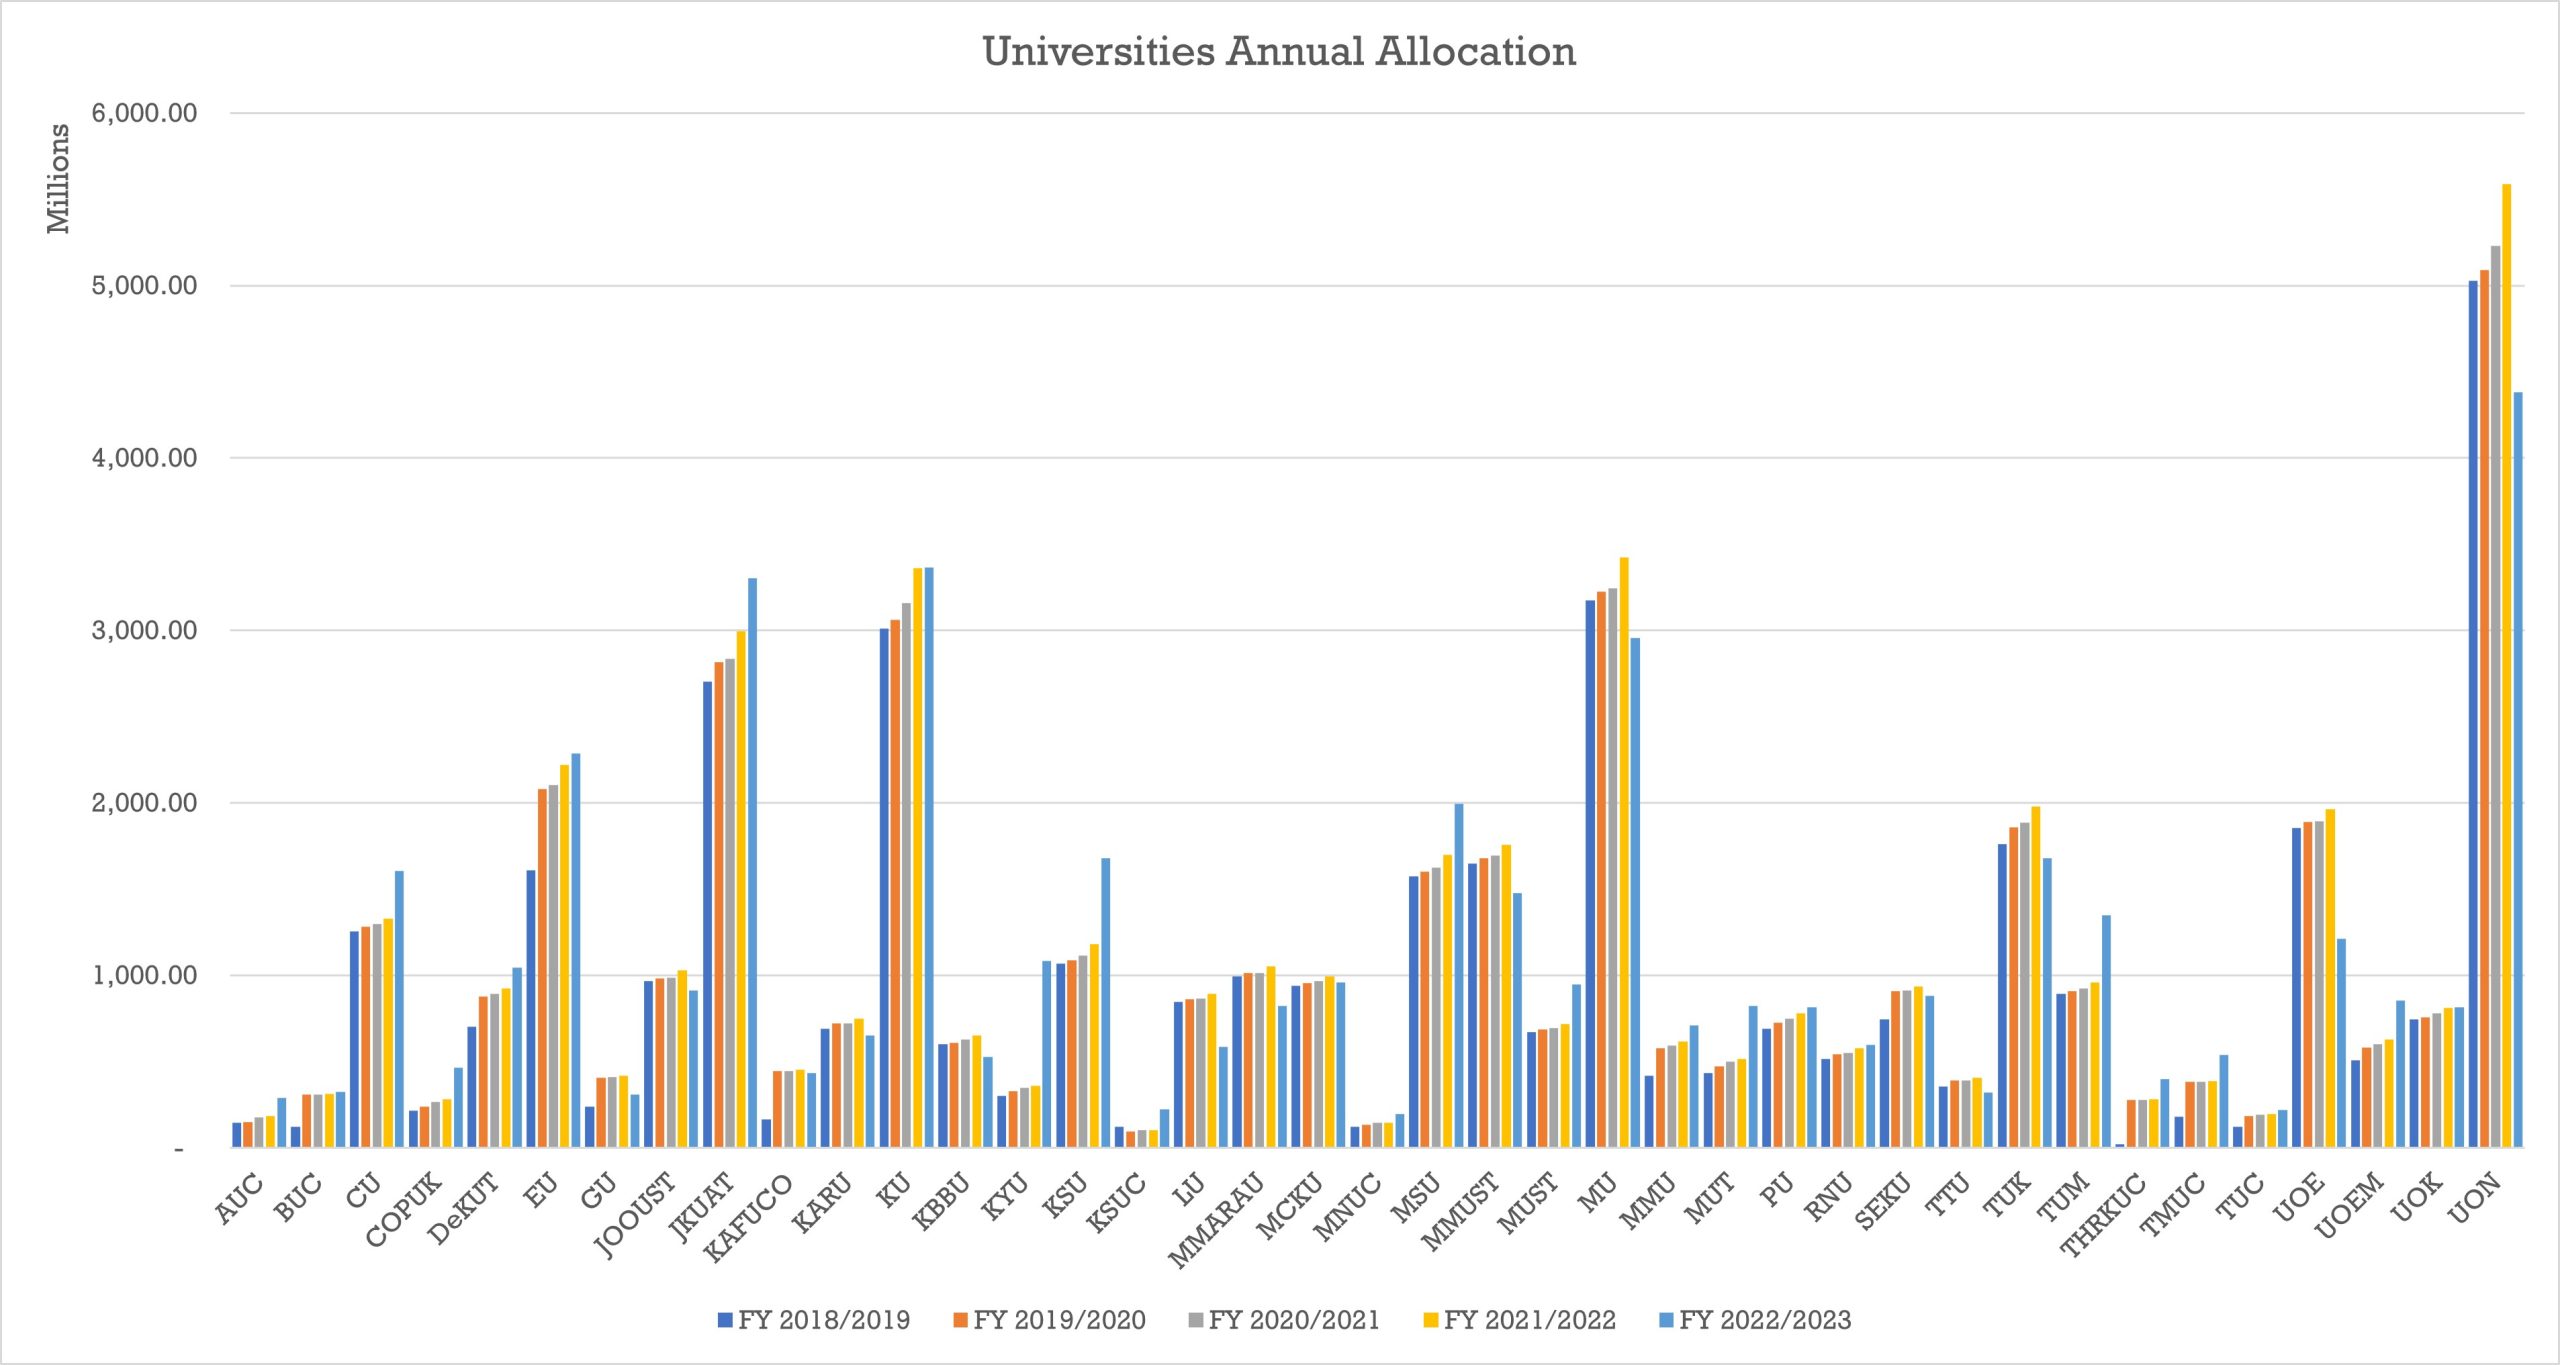
Graph 24 shows the amount allocated to all public universities since the Financial Year (FY) 2018/2019 to FY 2022/2023.
S/NO | UNIVERSITY | FY 2018/2019 | FY 2019/2020 | FY 2020/2021 | FY 2021/2022 | FY 2022/2023 |
1 | AUC | 144,776,390.82 | 149,660,400.32 | 177,970,337 | 182,566,737.92 | 287,886,087.66 |
2 | BUC | 120,800,000.00 | 307,033,543.97 | 308,758,938 | 311,889,606.19 | 323,125,920.76 |
3 | CU | 1,256,797,658.82 | 1,281,146,160.47 | 1,296,781,072 | 1,328,401,013.08 | 1,604,166,067.99 |
4 | COPUK | 215,471,847.78 | 239,214,109.77 | 265,475,235 | 281,903,409.94 | 463,984,223.78 |
5 | DeKUT | 703,174,517.57 | 875,795,325.17 | 892,580,404 | 922,317,148.90 | 1,043,846,394.24 |
6 | EU | 1,608,841,366.31 | 2,080,549,505.89 | 2,102,130,424 | 2,219,247,427.60 | 2,285,964,526.97 |
7 | GU | 237,964,119.29 | 406,965,646.27 | 408,749,808 | 417,371,563.99 | 310,293,526.72 |
8 | JOOUST | 966,180,844.17 | 984,144,967.48 | 985,692,712 | 1,027,756,804.43 | 914,203,480.55 |
9 | JKUAT | 2,703,875,495.51 | 2,814,542,455.40 | 2,835,105,762 | 2,996,814,921.49 | 3,301,612,337.76 |
10 | KAFUCO | 165,297,565.17 | 443,347,194.43 | 444,697,236 | 454,492,173.59 | 433,829,430.40 |
11 | KARU | 688,833,817.24 | 721,662,960.62 | 723,103,122 | 747,528,189.43 | 649,801,154.11 |
12 | KU | 3,011,419,606.66 | 3,059,906,838.66 | 3,160,138,763 | 3,360,804,178.63 | 3,366,979,243.23 |
13 | KBBU | 599,022,086.84 | 610,356,329.53 | 627,051,890 | 649,559,654.28 | 525,110,997.56 |
14 | KYU | 301,330,481.87 | 326,820,003.00 | 346,583,103 | 358,634,303.35 | 1,084,472,383.46 |
15 | KSU | 1,069,507,151.31 | 1,088,476,357.36 | 1,116,396,462 | 1,179,036,779.28 | 1,678,997,487.16 |
16 | KSUC | 120,800,000.00 | 95,000,000.00 | 102,807,584 | 104,230,444.32 | 223,577,465.24 |
17 | LU | 847,320,880.50 | 863,236,997.77 | 865,232,784 | 891,037,776.35 | 583,447,590.42 |
18 | MMARAU | 993,536,731.98 | 1,012,848,349.13 | 1,014,423,158 | 1,051,022,922.43 | 823,287,341.50 |
19 | MCKU | 938,972,622.98 | 957,026,139.73 | 967,726,469 | 995,444,566.13 | 957,871,239.56 |
20 | MNUC | 120,800,000.00 | 135,501,503.07 | 144,859,672 | 144,640,294.38 | 194,339,974.88 |
21 | MSU | 1,572,630,797.83 | 1,600,312,962.31 | 1,622,927,264 | 1,698,155,257.21 | 1,995,297,434.42 |
22 | MMUST | 1,648,785,364.57 | 1,679,290,278.13 | 1,695,388,307 | 1,755,534,211.41 | 1,475,369,227.62 |
23 | MUST | 672,276,070.47 | 685,064,868.14 | 693,973,573 | 715,844,544.64 | 948,469,572.05 |
24 | MU | 3,173,815,843.42 | 3,224,704,567.86 | 3,244,028,579 | 3,424,222,563.39 | 2,955,850,762.63 |
25 | MMU | 415,947,876.55 | 576,176,129.69 | 591,962,384 | 617,024,827.44 | 711,492,763.35 |
26 | MUT | 433,056,351.33 | 471,064,051.01 | 498,747,060 | 513,557,561.92 | 823,883,081.05 |
27 | PU | 691,549,189.96 | 724,248,198.65 | 749,450,106 | 780,899,331.35 | 813,155,643.03 |
28 | RNU | 515,244,186.80 | 540,629,870.22 | 551,928,658 | 576,353,490.01 | 595,137,645.40 |
29 | SEKU | 744,377,559.38 | 908,373,853.41 | 911,120,641 | 936,512,681.92 | 882,511,326.22 |
30 | TTU | 354,376,306.25 | 391,027,810.08 | 392,306,046 | 404,458,305.58 | 321,215,969.55 |
31 | TUK | 1,760,753,015.24 | 1,858,525,826.34 | 1,886,456,713 | 1,980,748,429.69 | 1,677,683,125.11 |
32 | TUM | 891,158,905.11 | 906,899,795.44 | 924,040,048 | 958,413,181.77 | 1,346,517,833.31 |
33 | THRKUC | 20,000,000.00 | 276,947,985.14 | 279,085,239 | 283,363,099.11 | 399,642,164.87 |
34 | TMUC | 180,386,705.51 | 381,990,108.28 | 383,346,825 | 387,544,401.64 | 540,417,326.39 |
35 | TUC | 120,800,000.00 | 183,426,058.24 | 191,134,117 | 195,974,416.13 | 217,404,519.30 |
36 | UOE | 1,855,079,061.75 | 1,890,125,108.66 | 1,891,495,354 | 1,965,428,463.73 | 1,212,967,831.37 |
37 | UOEM | 508,547,301.99 | 580,185,658.19 | 600,229,304 | 626,179,421.53 | 855,334,993.34 |
38 | UOK | 743,510,253.94 | 756,515,942.75 | 781,730,052 | 811,015,006.67 | 814,281,022.89 |
39 | UON | 5,028,147,024.56 | 5,091,470,928.43 | 5,231,805,014 | 5,588,025,893.18 | 4,380,525,884.13 |